System
The HSYCO System Monitor I/O Server is used to monitor several key hardware and operating system parameters of an HSYCO server:
- Operating system boot time
- HSYCO start time
- Disk space
- Java memory (used, free and maximum available memory)
- Java total number of file descriptors currently open and number of threads used
- Performance (CPU percent busy time, 1 minute load average, 5 minutes load average)
- Console error messages
- Internet connection status
- Cameras status
- I/O Servers status
- Database update, backup and de-fragmentation times
- Clock drift of remote HSYCO servers monitored through the HSYCOREMOTE I/O server.
It also supports the hardware watchdog if available and supported by the Linux operating system.
HSYCO Configuration
You can have only one HSYCO System Monitor I/O Server.
Add a SYSTEM I/O Server in the I/O Servers section of the Settings and set its parameters.
note
Note that the SYSTEM I/O Server doesn't count in the I/O servers license total, so you don't need an extra I/O Server license to use SYSTEM with HSYCO.
High Availability
- Shutdown when inactive: defaults to false.
Options
| ID | Default | Values | Description |
|---|---|---|---|
| gui | true | true | enable support for the UI object, UISET actions and USER commands |
| false | disable UI support | ||
| internetmonitor | true | true | enable internet connection check |
| false | disable internet connection check | ||
| pollinterval | 30 | n ≥ 10 | the data acquisition interval, in seconds |
| watchdog | false | true | enable the Linux hardware watchdog |
| false | disable the Linux hardware watchdog |
Datapoints
| ID | Value | R/W | Description |
|---|---|---|---|
| time | <val> | R | the system’s timestamp, in milliseconds |
| W | sets the system’s time. Valid formats are: time in milliseconds, "yyyy-mm-dd hh:mm:ss" and "yyyymmddhhmmss" | ||
| start.elapsed | <val> | R | number of seconds since HSYCO start-up time |
| start.time | <date> | R | HSYCO start-up time, formatted as "YYYY-MM- DD hh:mm:ss", for example: "2012-09-29 22:36:43" |
| boot.elapsed | <val> | R | number of seconds since operating system boot time |
| boot.time | <date> | R | operating system boot time, formatted as "YYYY-MM-DD hh:mm:ss", for example: "2012-09-29 22:36:43" |
| cpu.model | <val> | R | CPU model name (may not be available on some hardware platforms) |
| cpu.revision | <val> | R | CPU revision (may not be available on some hardware platforms) |
| cpu.usage | <val> | R | CPU percent busy time |
| load.avg.1 | <val> | R | the system’s load average during the last 60 seconds |
| load.avg.5 | <val> | R | the system’s load average during the last 5 minutes |
| load.avg.15 | <val> | R | the system’s load average during the last 15 minutes |
| process.files | <val> | R | total number of file descriptors currently opened by the JVM process |
| process.threads | <val> | R | total number of threads used by the JVM process |
| database.backup.elapsed | <val> | R | number of seconds since last database backup |
| database.backup.time | <val> | R | amount of time, in seconds, to execute the last database backup |
| database.backup.consolidation.elapsed | <val> | R | number of seconds since last database backup consolidation |
| database.backup.consolidation.status | done | R | backup consolidation completed successfully |
| error=1 | R | backup consolidation generic execution error | |
| error=2 | R | backup consolidation execution aborted because backup file not found | |
| error=3 | R | backup consolidation execution aborted because not enough space was available | |
| exception | R | backup consolidation generic execution exception | |
| nospace | R | backup consolidation not started because not enough space was available | |
| runaway | R | backup consolidation aborted due to runaway script file or data file | |
| runaway.zip | R | backup consolidation aborted due to runaway zip file | |
| stalled.post | R | backup consolidation aborted due to stalled script file (postprocessing) | |
| stalled.pre | R | backup consolidation aborted due to stalled script file (preprocessing) | |
| stalled.scripting | R | backup consolidation aborted due to stalled script file (scripting) | |
| stalled.zip | R | backup consolidation aborted due to stalled script file (zipping) | |
| database.backup.consolidation.time | <val> | R | amount of time, in seconds, to execute the last database backup consolidation |
| database.defrag.elapsed | <val> | R | number of seconds since last database de-fragmentation |
| database.defrag.time | <val> | R | amount of time, in seconds, to execute the last database de-fragmentation |
| database.update.elapsed | <val> | R | number of seconds since last database persistent update (data saved to the data/hsyco.data file) |
| disk.free.percent | <val> | R | the free storage space as a percentage of total available space |
| disk.free | <val> | R | the free storage space in Mbytes |
| disk.used | <val> | R | the used storage space in Mbytes |
| disk.errors | <val> | R | only available when the root filesystem is BTRFS, this is the sum of all error counters as returned by the "btrfs devices stats /" command |
| hsyco.version | <val> | R | HSYCO version, for example: "3.7.0 Build 0130" |
| java.version | <val> | R | Java VM version, for example: "Oracle Corporation 1.8.0_112" |
| os.version | <val> | R | Operating system version, for example: "Linux 4.14.34-v7+ arm" |
| memory.free | <val> | R | the amount of free run-time memory of the Java virtual machine, in Mbyte |
| memory.max | <val> | R | the maximum amount of run-time memory that could be used by the Java virtual machine, in Mbyte |
| memory.used | <val> | R | the amount of run-time memory used by the Java virtual machine, in Mbyte |
| camera.total | <val> | R | the total number of cameras defined |
| camera.errors | <val> | R | the number of cameras that HSYCO is unable to access |
| camera.errors.list | <list> | R | a comma separated list of the cameras having errors, or an empty string if there are no errors |
| io.total | <val> | R | the total number of I/O servers defined |
| io.errors | <val> | R | the number of I/O servers that HSYCO is unable to access |
| io.errors.list | <list> | R | a comma separated list of the I/O servers having errors, or an empty string if there are no errors |
| internet.connection | online | R | Internet access from HSYCO is working properly |
| offline | R | HSYCO is unable to access the Internet | |
| ha.slave.connection | online | R | the slave is reachable. Only available when HSYCO is configured as High Availability master |
| offline | R | the slave is not reachable. Only available when HSYCO is configured as High Availability master | |
| console.errors | 0 | R | the console.log file contains no new errors |
| 1 | R | the console.log file contains new errors | |
| watchdog | active | R | watchdog is enabled and active |
| error | R | watchdog is enabled but failed to update the watchdog device (/dev/watchdog) |
User Interface
UISET Actions
| ID | Attribute | Set To | Description |
|---|---|---|---|
| boot.time | value | operating system boot time | |
| start.time | value | HSYCO start-up time | |
| cpu.usage | value | CPU percent busy time | |
| load.avg.1 | value | the system’s load average during the last 60 seconds | |
| load.avg.5 | value | the system’s load average during the last 5 minutes | |
| disk.free.percent | value | the free storage space as a percentage of total available space | |
| blink | true | when the free storage space is below 10% | |
| false | when the free storage space is equal or above 10% | ||
| disk.errors | value | only available when the root filesystem is BTRFS, this is the sum of all error counters as returned by the "btrfs devices stats /" command | |
| visible | true | the root filesystem is BTRFS | |
| false | the root filesystem is not BTRFS | ||
| memory.free | value | the amount of free run-time memory of the Java virtual machine, in Mbyte | |
| memory.max | value | the maximum amount of run-time memory that could be used by the Java virtual machine, in Mbyte | |
| memory.used | value | the amount of run-time memory used by the Java virtual machine, in Mbyte | |
| camera.errors | value | ERROR | when HSYCO cannot access one or more cameras |
| blink | true | ||
| value | OK | when all cameras are connected | |
| blink | false | ||
| io.errors | value | ERROR | when HSYCO cannot access one or more I/O servers |
| blink | true | ||
| value | OK | when all I/O servers are connected | |
| blink | false | ||
| internet.connection | value | ERROR | when HSYCO is unable to access the Internet |
| blink | true | ||
| value | OK | when Internet access from HSYCO is working properly | |
| blink | false | ||
| console.errors | value | ERROR | when the console.log file contains new error messages |
| blink | true | ||
| value | OK | when the console.log file contains no new errors | |
| blink | false | ||
| messages | value | the list of cameras and I/O servers with errors |
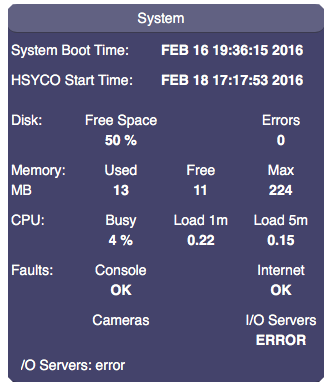
HSYCO monitor UI Object
A panel that monitors the system. These parameters are displayed:
- system boot time
- HSYCO start time
- disk free space
- memory in MBs: used, free, max
- CPU usage in %: busy, load 1m, load 5m
- faults: console, internet, cameras, I/O servers
- error messages
Parameters
- server id: the server ID.
- label: the text label on the panel. Can contain HTML tags
- position: the object's position. Use the pixels or rows and columns coordinates format
Release Notes
4.0.0
-
- new ha.slave.connection datapoint
3.7.0
- new data points:
- *cpu.model
- *cpu.revision
- *database.backup.time
- *database.backup.elapsed
- *database.backup.consolidation.time
- *database.backup.consolidation.elapsed
- *database.backup.consolidation.status
- *database.defrag.time
- *database.defrag.elapsed
- *database.update.elapsed
- *hsyco.version
- *java.version
- *os.version
3.6.0
- new "process.files" data point returns the total number of file descriptors currently opened by the JVM process
- new "process.threads" data point returns the total number of threads used by the JVM process
- new "watchdog" option: when true, enables the hardware watchdog on Linux servers
- the "time" data point can now be written to set the system's clock
3.5.1
- support for BTRFS root file system errors monitor
3.5.0
- new "internetmonitor" option. Set to "false" to disable Internet connection check
3.2.1
- the (hsycomonitor) object displayed an error on cameras if there were no cameras defined
3.2.0
- initial release