Datalogger Range
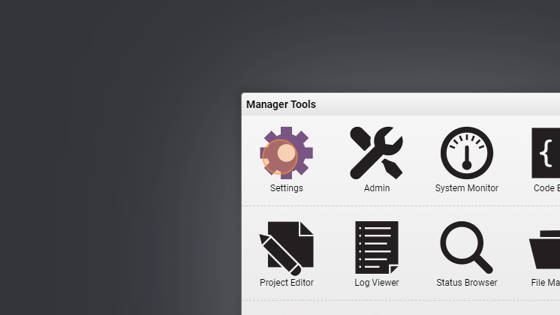
- Navigate to HSYCO Manager
Tip: We'll firstly define the WXONLINE Server and modify one parameter to retrieve the weather information from the city you want
- Go into "Setting"
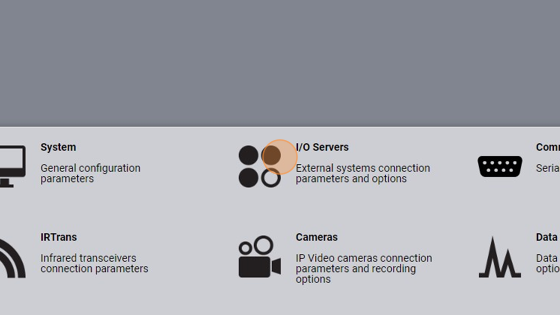
- Open the "I/O Server" section
- Click "+" to add a new server

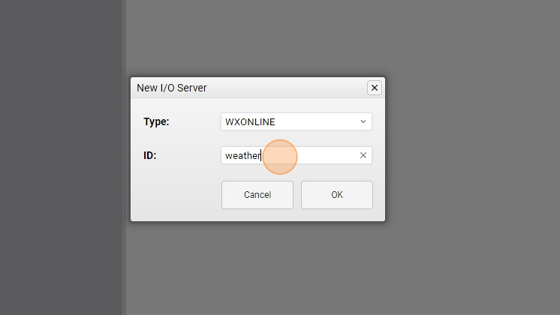
- Select "WXONLINE" from the "Type" field
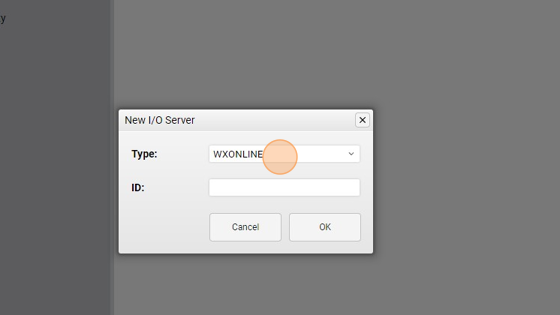
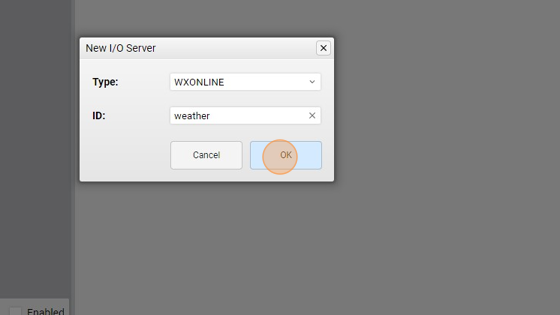
- Give the server an ID ("weather" for example)
- Click "OK" to confirm
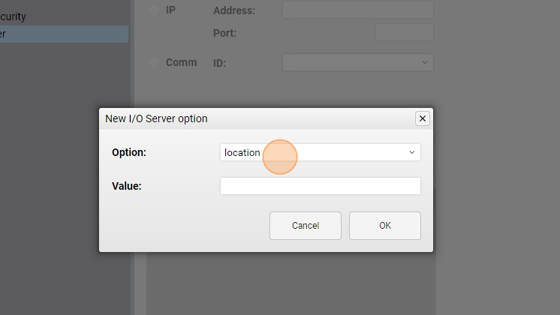
- Click "+" in the "Options" panel to add an attribute

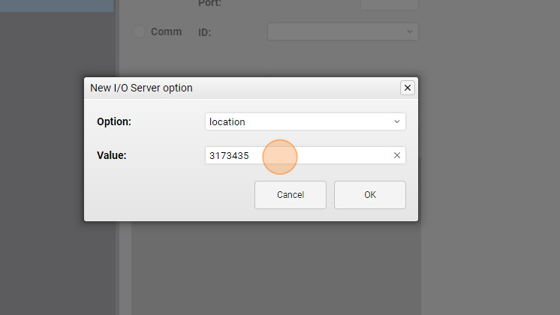
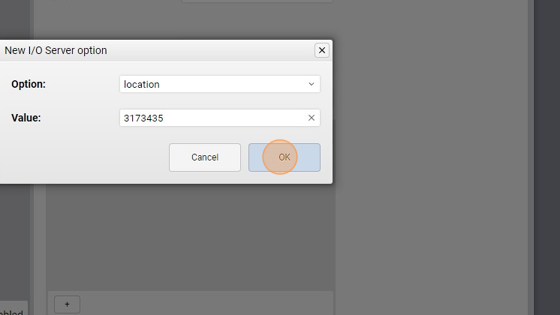
- Select the "location" from the "Option" select
10. Put here the ID of the target location or coordinates. You can retrieve this by going in the OpenWeatherMap website ( https://openweathermap.org/ ) and search for the city you would like to get the data from. The numbers after the last '/' in the URL represents the ID of that city
- Click "OK" to confirm
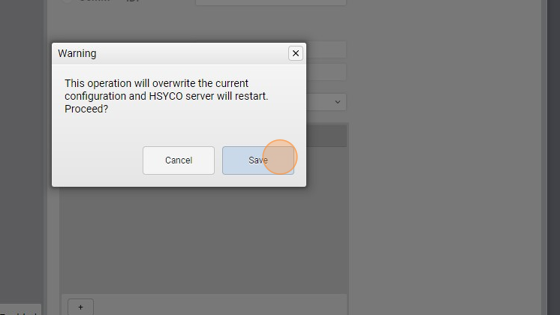
- Click "Save"

- Click "Save" again and wait for HSYCO to restart
Tip: Now that we defined the Server, we'll create the project and assign the range data logger to a Datalogger object in the Project Editor
- Create a new project or open an existing one
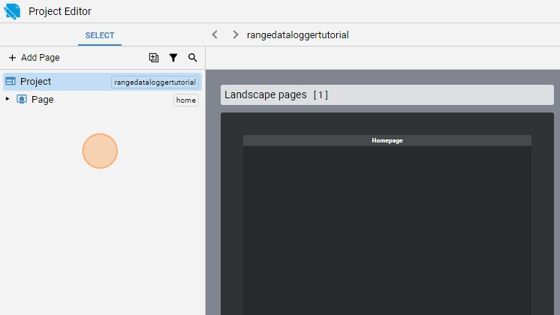
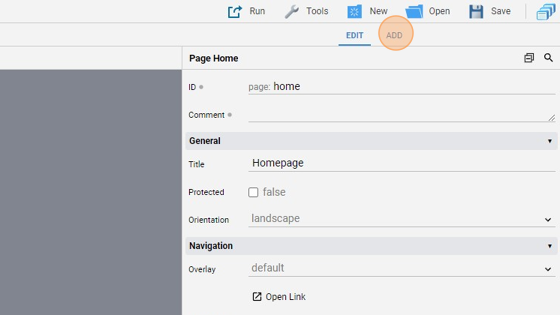
- Go into the Home page
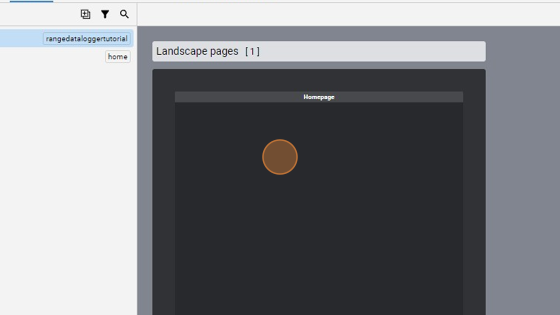
- Click "add"
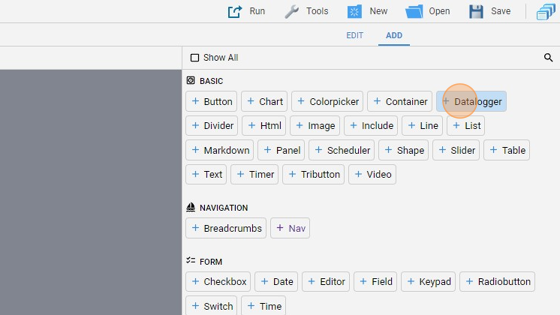
- Add a "Datalogger"
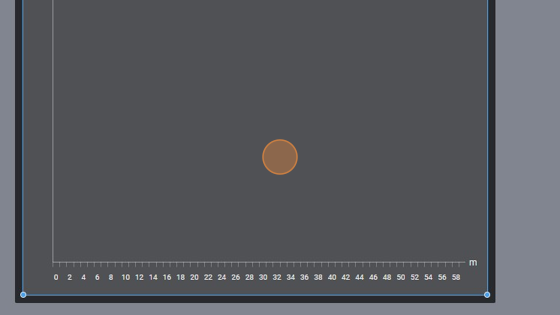
- Resize it so that it fits the entire page
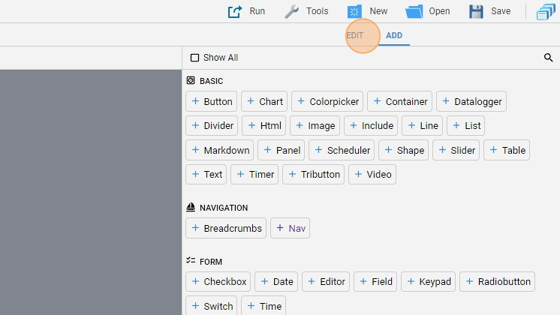
- Go back to "edit" mode
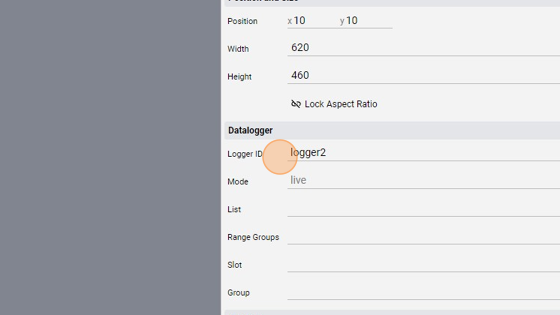
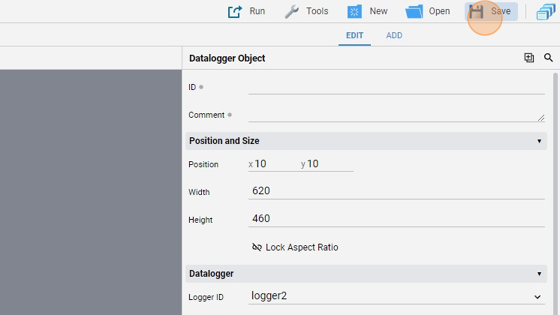
20. Change the "Logger ID" to "logger2". This is the ID of the range logger defined in the settings
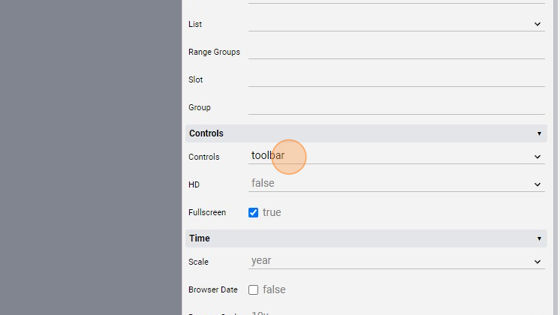
- Change the "Controls" to "toolbar"
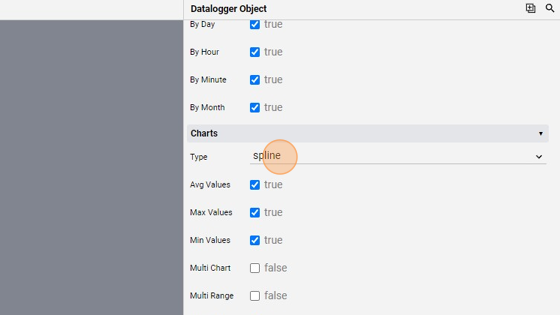
22. Change the "Type" to "spline". This draws a spline connecting the values
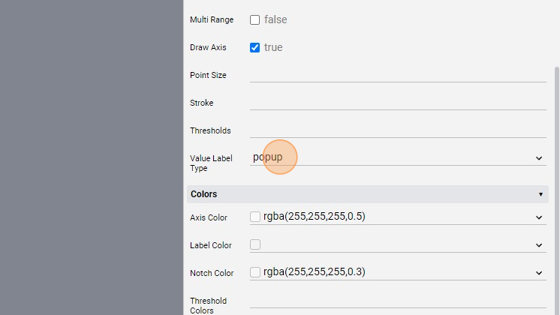
- Change the "Value Label Type" to "popup"
- Click "Save" to save the project
Tip: Great! Now the last thing to do is write some code that updates this Datalogger
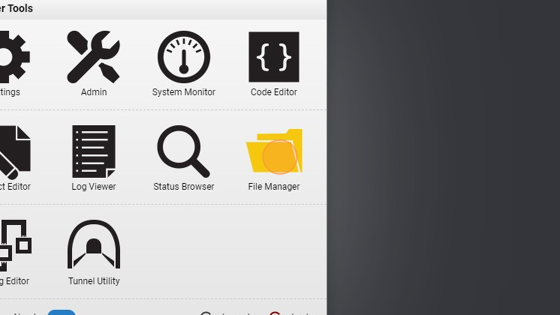
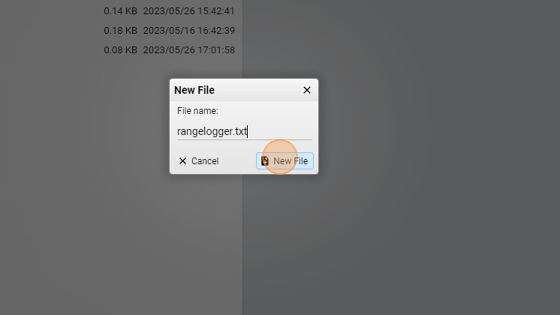
- Go into the "File Manager"
- Navigate in the "events" folder
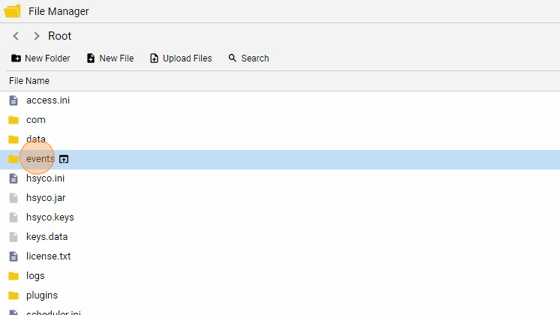
- Click "New File"
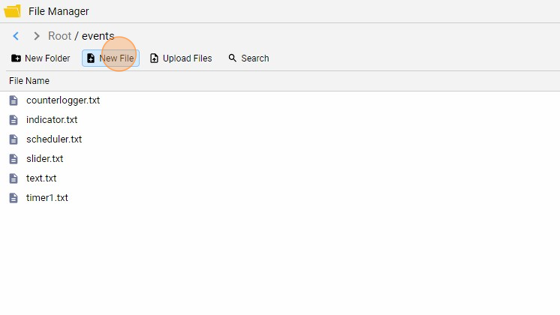
- Give it a name ("rangelogger.txt" for example) and click "New File"
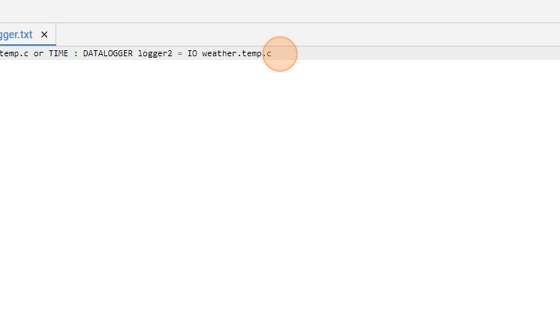
**29. Copy the following code in the file and save it:
IO weather.temp.c or TIME : DATALOGGER logger2 = IO weather.temp.c
What this does is it updates the values for data logger with ID "logger2" with the temperature value (in Celsius) from the "weather" server. It updates it every time the temperature changes or every minute**
Tip: Now we can test it!
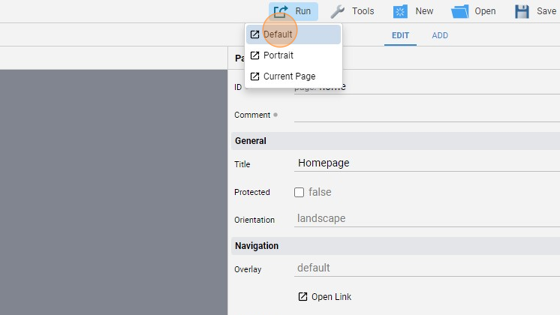
- Open the Project Editor, click "Run" and then "Default" to launch the application
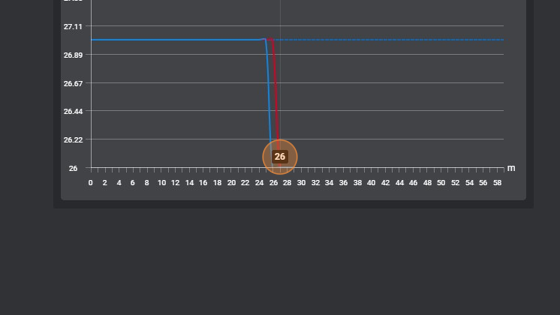
- After some time has passed, the graph will have formed with the temperatures over time
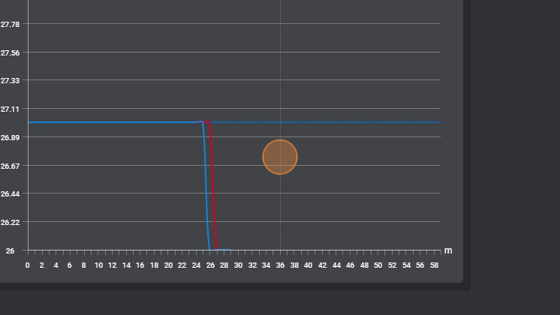
- As you can see, if we hove over the graph we see the popup values
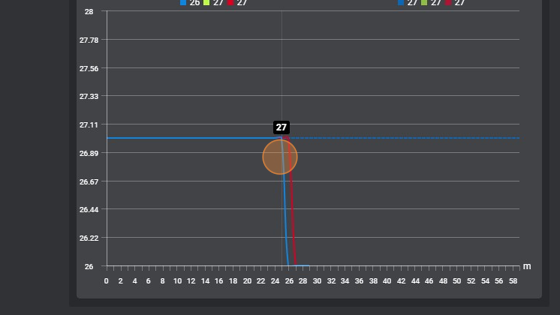
- The graph is a spline as we defined it in the Datalogger attributes so all the values are connected through a spline