Status Browser
The Status Browser, allows you to show the real time status of data points, user interface attributes and variables.
Open the Manager and press the Status Browser icon.
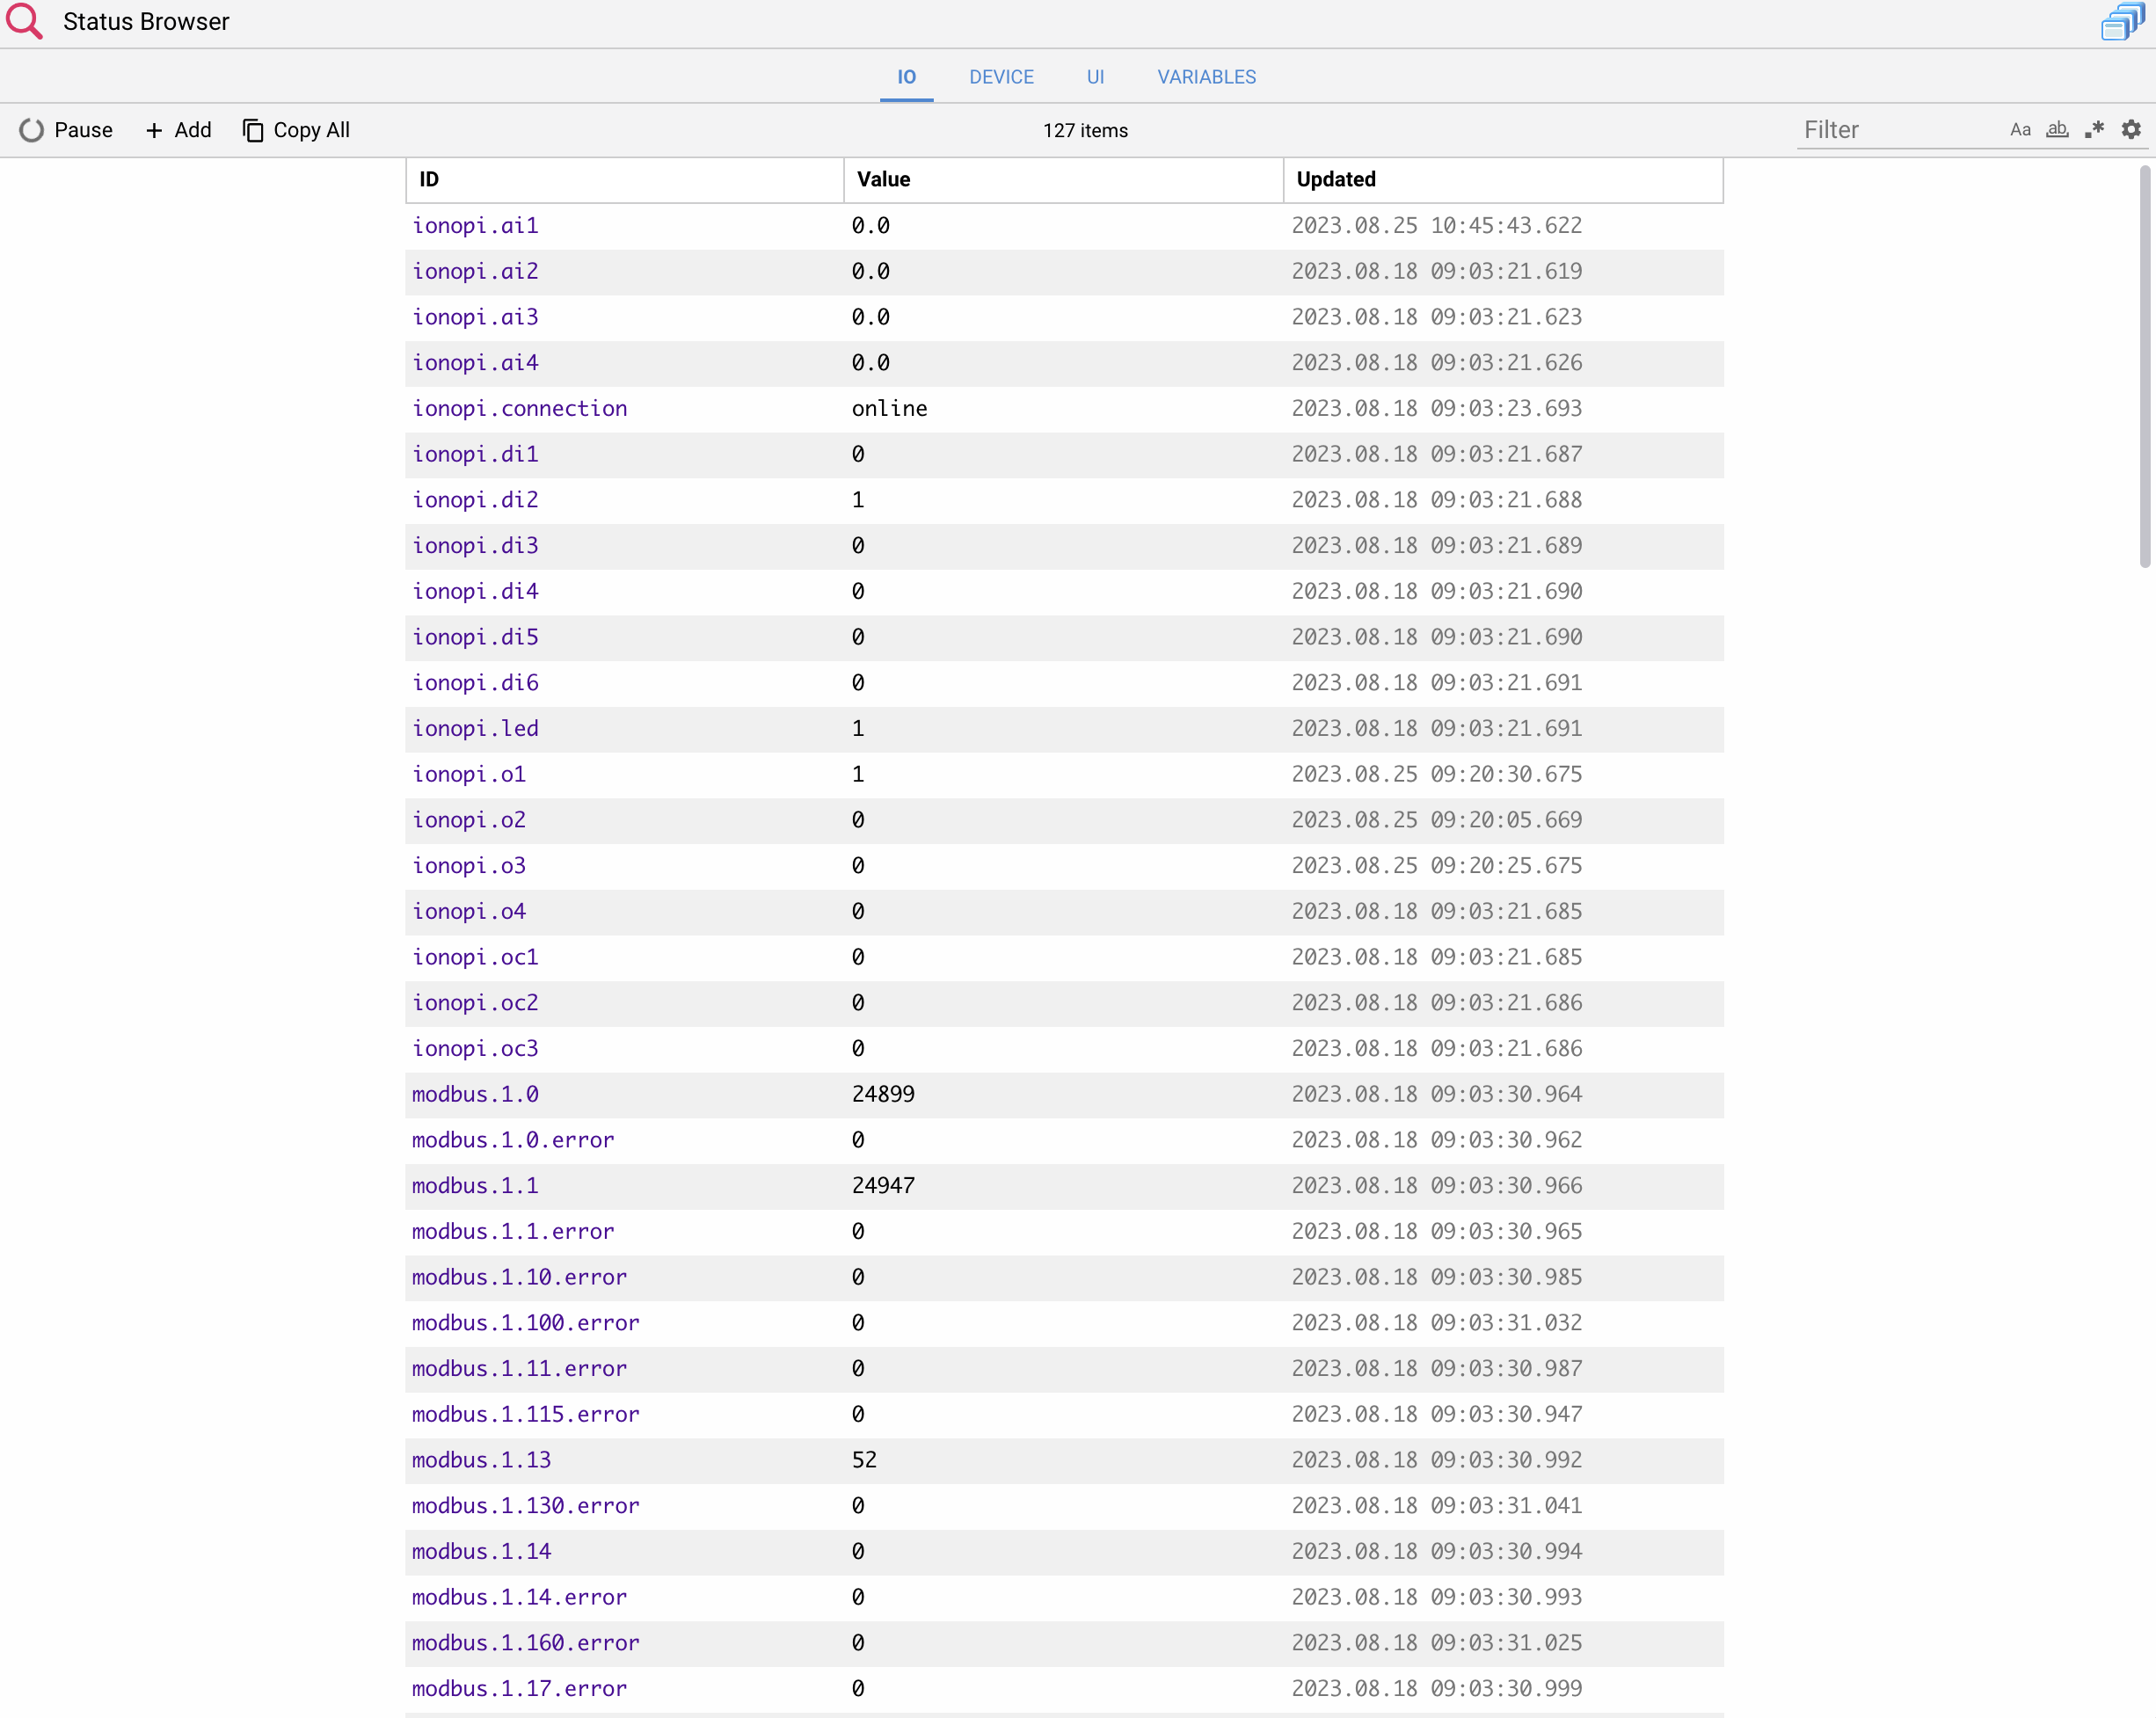
The data point tab shows the real time values of all I/O data points, and the time stamp of each data point last change.
You can pause the real time update, and filter the list by data point name.
The Device tab shows a list of the the lights, dimmer and automation set by deviceSet().
The UI attributes tab shows all user interface ids and attributes with values that have been set with the UISET or uiSet() methods.
The Variables tab shows all the volatile and persistent variables used by EVENTS/Javascript/Java programming.
In order to view session specific attributes, you should open a tab or window on the same browser where you are using the Manager, and then select the show session data checkbox in the Status Browser. This will show both global and session data for that tab.
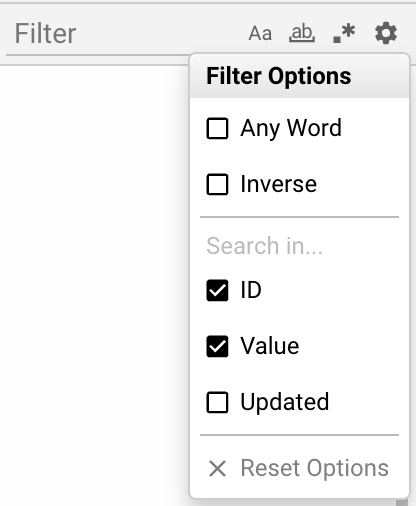
Search Tool
Select Aa for case sensitive filtering.
Select ab to match whole word.
Select .* for regular expressions.
Toggle Any Word to alternate between text searching for individual isolated words and text searching for the entire phrase.
Select Inverse to search for every log lines except the ones with the word in the filter field.
Edit Search In to search in IDs, values and updated values.
In any moment you can reset the filter options by pressing Reset options