Chapter 11: System and Strato I/O Servers
Most I/O Servers in HSYCO connect outward, to KNX buses, Modbus devices, BACnet controllers, cameras, and other building systems. This chapter covers two I/O Servers that connect inward, to the server hardware itself.
The first is the SYSTEM I/O Server, available on every HSYCO installation regardless of hardware. It monitors the health of the HSYCO server: disk space, memory, CPU load, database status, camera connectivity, and I/O Server connectivity. Every installation should have it configured. It is how you know whether your system is running well or whether something needs attention.
The second group covers the Strato and StratoPiMax I/O Servers, which are specific to HSYCO servers built on Sfera Labs Strato Pi hardware, the Pi family (Base, UPS, CM, CM Duo) and the PRO, ENTERPRISE, and CORE servers respectively. These I/O Servers activate the hardware watchdog, expose the server's internal hardware state as datapoints, and give you access to features like the buzzer, real-time clock, and fan control that are only available through the underlying Strato Pi kernel module.
Without the appropriate Strato I/O Server configured on Strato Pi hardware, the watchdog is not active and built-in hardware features are not accessible. On those platforms, this I/O Server is required for the server to be fully operational.
Neither the SYSTEM I/O Server nor the Strato/StratoPiMax I/O Servers count against your I/O Servers license total.
11.1 System I/O Servers
You can have only one SYSTEM I/O Server per installation. Add it through the I/O Servers section of Settings, give it a Name, and it is ready, no further configuration is required to start seeing datapoints.
Note: The SYSTEM I/O Server does not count against your I/O Servers license total.
There are a few options worth knowing about:
For High Availability installations, Shutdown when inactive defaults to false.
11.1.1 The System Monitor
System Monitor is a dedicated application in the Manager, used to monitor several key hardware and operating system parameters of the HSYCO server. You access it from the Manager splash screen alongside Settings, Status Browser, Log Viewer, and the other Manager tools.
It is available when the SYSTEM I/O Server is configured (Figure 44).
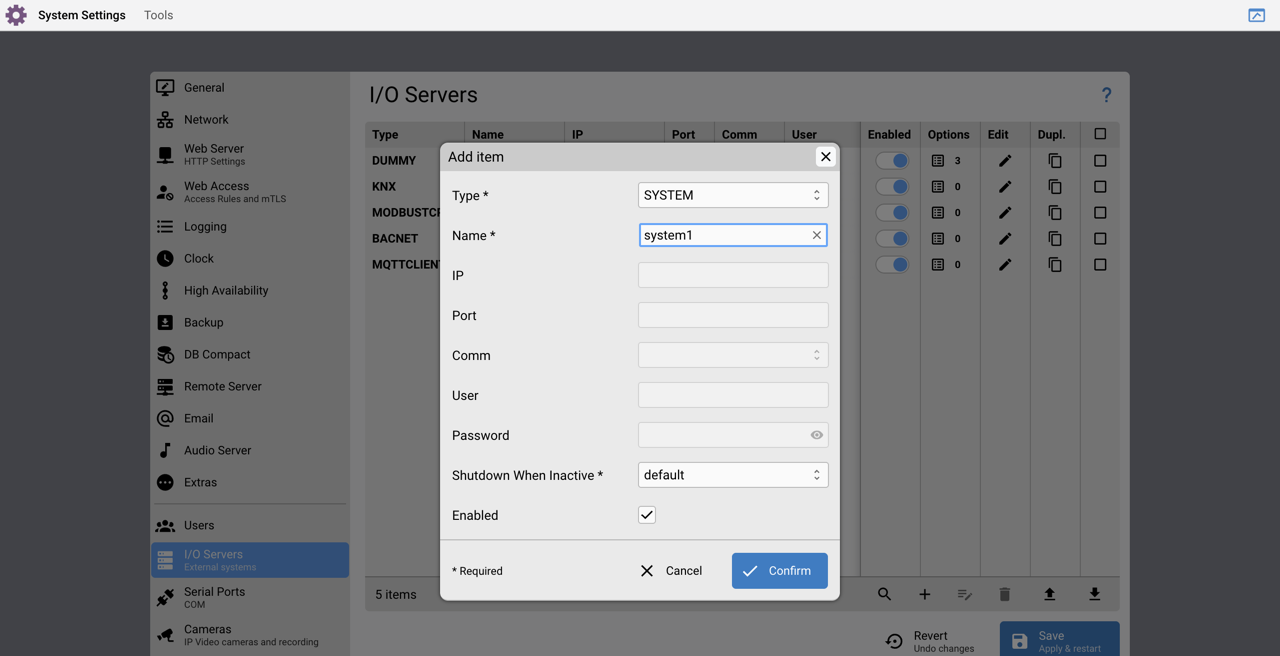
The SYSTEM I/O Server's Settings page
The SYSTEM I/O Server has four options:
| Option | Default | Description |
|---|---|---|
gui | true | Enable support for the System Monitor object, UISET actions, and USER commands. Set to false to disable UI support. |
internetmonitor | true | Enable the internet connection check. Set to false to disable it. |
pollinterval | 30 | How often HSYCO reads the system parameters, in seconds. Minimum value is 10. |
watchdog | false | Set to true to enable the Linux hardware watchdog, if available and supported by the operating system. |
System Boot time: the operating system boot time, formatted as YYYY-MM-DD hh:mm:ss. This is when the Linux operating system started.
HSYCO Start time: the HSYCO start-up time, formatted as YYYY-MM-DD hh:mm:ss. This is when HSYCO itself started running.
Disk: Free Space: the free storage space as a percentage of total available space (disk.free.percent).
Memory: the run-time memory of the Java virtual machine, in MB:
-
Used: the amount of run-time memory currently used by the Java virtual machine (
memory.used) -
Free: the amount of free run-time memory of the Java virtual machine (
memory.free) -
Max: the maximum amount of run-time memory that could be used by the Java virtual machine (
memory.max)
CPU: processor activity:
-
Busy: CPU percent busy time (
cpu.usage) -
Load 1m: the system's load average during the last 60 seconds (
load.avg.1) -
Load 5m: the system's load average during the last 5 minutes (
load.avg.5)
Faults: connection status for each monitored component:
-
Console:
OKwhen the console.log file contains no new errors;ERRORwhen it contains new errors -
Internet:
OKwhen Internet access from HSYCO is working properly;ERRORwhen HSYCO is unable to access the Internet -
Cameras:
OKwhen all cameras are connected;ERRORwhen HSYCO cannot access one or more cameras -
I/O Servers:
OKwhen all I/O Servers are connected;ERRORwhen HSYCO cannot access one or more I/O Servers
When any Faults entry shows ERROR it also blinks to draw attention.
Messages: the list of cameras and I/O Servers that have errors.
11.1.2 Key System Datapoints to Monitor
You can inspect all SYSTEM datapoints at any time in the Status Browser. In the Manager, open the Status Browser and filter by your SYSTEM I/O Server ID (e.g., system). You will see the current value of every datapoint listed below.
| Datapoint | Normal value | What it tells you |
|---|---|---|
database.update.elapsed | Low (see note) | Seconds since HSYCO last saved its database to disk. A climbing value is a warning sign. |
database.backup.consolidation.time | Low | Seconds to complete the last backup consolidation. Growing values indicate storage stress. |
database.backup.consolidation.status | done | Result of the last backup consolidation. Any value other than done means it failed. |
load.avg.1 / load.avg.5 | Varies (see note) | System load averages over the last 1 and 5 minutes. See the note below for guidance. |
cpu.usage | Low | CPU percent busy time. Sustained high values slow down event processing and I/O Servers. |
disk.free.percent | > 10% | Free storage as a percentage of total. HSYCO flags a problem below 10%. |
console.errors | 0 | 0 = the console log file contains no new errors; 1 = it contains new errors. |
io.errors | 0 | Number of I/O Servers HSYCO cannot access. Check io.errors.list for which ones. |
Notes on "Normal Value" column:
-
database.update.elapsed: The HSYCO documentation does not define a specific threshold. Based on practical experience, values consistently above 120 seconds are a warning sign worth investigating. -
load.avg.1/load.avg.5: The HSYCO documentation does not
define thresholds. cpu.usage tells you how hard the CPU is working; load averages tell you how many tasks are competing for it. Load average equals the number of CPU cores under full load. On a Raspberry Pi 4 (4 cores): a value of 2.0 means 50% utilization (fine); a value of 6.0 means processes are queuing. load.avg.5 is smoothed over 5 minutes; use it alongside load.avg.1 to tell a momentary spike from a sustained problem.
11.1.3 Recipe: Telegram Alerts for System Health
You can send real-time alerts to your phone when something goes wrong through Telegram.
you must first create a Telegram bot and configure an I/O Server in HSYCO.
Step 1: Create a Telegram Bot
Using your Telegram account, open Telegram and send the /newbot command to BotFather. BotFather will ask you for a bot name and username. Your username must be 5-32 characters, contain only Latin letters, numbers, and underscores, and must end in 'bot' (for example, homeautomation_bot or HSYCOBot). BotFather will generate an authorization token; save this token, you'll need it next.
Step 2: Add the Telegram I/O Server in Settings
Open the Manager and go to Settings → I/O Servers. Click + and select Telegram as the type. Give it a Name (for example, telegram).
Step 3: Configure the Token
In the Telegram I/O Server settings, set the token parameter to the authorization token you received from BotFather.
Note: The Telegram I/O Server does not count against your I/O Server license total.
Step 4: Register the recipients
The alert rules below use telegram.message.all, which sends only to registered users, so without this step the rules fire but reach nobody. Set the password option on the Telegram I/O Server to any phrase (spaces are allowed; the match is case-sensitive, leading and trailing spaces ignored). Then, from each phone that should receive alerts, open a chat with the bot and send exactly that phrase. HSYCO adds that user to its registered list, stored in telegram-<telegram I/O Server ID>.ini in the root directory. To send to one specific person instead, use telegram.message.<user id>.
Replace system with your SYSTEM I/O Server ID and telegram with your Telegram I/O Server ID.
Console Errors
IO system.console.errors = 1 :
IO telegram.message.all = "Alert: console log is not empty"
I/O Server Connection Errors
This recipe uses a PROGRAMTIMER to avoid sending repeated alerts for the same error. When an I/O Server error is detected, a 90-second timer is started. The alert is only sent when the timer fires, not on every datapoint change. The variable $io-servers-list captures the list of disconnected servers at the moment the alert is sent.
NOT IO system.io.errors.list = "" :
PROGRAMTIMER system-io-error-alert = SET 90
IO system.io.errors.list = "" :
PROGRAMTIMER system-io-error-alert = CLEAR
PROGRAMTIMER system-io-error-alert :
$io-servers-list = IO system.io.errors.list,
IO telegram.message.all = "Alert: I/O Server errors: " $io-servers-list
Database Update Past Due
IO system.database.update.elapsed > 120 :
IO telegram.message.all = "Warning! Database update past due"
Database Backup Consolidation Error
NOT IO system.database.backup.consolidation.status = done :
$consolidation-status = IO system.database.backup.consolidation.status,
IO telegram.message.all = "Warning! DB consolidation status error: " $consolidation-status
Database Backup Consolidation Taking Too Long
IO system.database.backup.consolidation.time > 300 :
$consolidation-time = IO system.database.backup.consolidation.time,
IO telegram.message.all = "Warning! DB consolidation taking too long: " $consolidation-time
Database Backup Past Due
database.backup.elapsed counts seconds since the last database backup. The threshold of 90000 seconds (25 hours) allows for some tolerance around the daily backup schedule.
IO system.database.backup.elapsed > 90000 :
IO telegram.message.all = "Warning! Database backup past due"
Database Backup Taking Too Long
IO system.database.backup.time > 120 :
IO telegram.message.all = "Warning! Database backup taking too long"
Email Alerts via SMTP
In addition to Telegram notifications, HSYCO can send email alerts through the MAIL action. To enable email notifications, you must configure SMTP parameters in Settings (Email section).
The main parameters are:
SmtpName: the name or numeric IP address of the SMTP server, used to send messages through a specific authenticated and secured SMTP account.
SmtpPort: the SMTP server's port number, if different from the default (25 for unencrypted traffic, 465 for SMTP over SSL, 587 for ESMTP).
SmtpUser: the account username used to authenticate the connection to the SMTP server.
SmtpPassword: the account password used to authenticate the connection to the SMTP server.
SmtpSSL: the encryption mode: true for SMTP over SSL, esmtp for ESMTP (with STARTTLS support), or false for servers that do not support traffic encryption.
These parameters must be set according to your mail service provider. Each provider (for example Gmail, Outlook, Brevo, or a corporate mail service) supplies its own specific values, which must be entered correctly for the configuration to work.
Important: If these parameters are not set, HSYCO will not be able to send any email.
Console Errors
IO system.console.errors = 1 :
MAIL admin@example.com = hsyco@example.net "System Alert" "Console log is not empty"
I/O Server Connection Errors
This recipe uses a PROGRAMTIMER to avoid sending repeated emails for the same error:
NOT IO system.io.errors.list = "" :
PROGRAMTIMER system-io-error-alert = SET 90
IO system.io.errors.list = "" :
PROGRAMTIMER system-io-error-alert = CLEAR
PROGRAMTIMER system-io-error-alert :
$io-servers-list = IO system.io.errors.list,
MAIL admin@example.com = hsyco@hsyco.net "I/O Server Alert" "I/O Server errors detected: " $io-servers-list
Database Backup Past Due
IO system.database.backup.elapsed > 90000 :
MAIL admin@example.com = hsyco@example.net "Database Alert" "Warning! Database backup is past due (over 25 hours since last backup)"
Database Backup Taking Too Long
IO system.database.backup.time > 120 :
MAIL admin@example.com = hsyco@example.net "Database Alert" "Warning! Database backup taking too long"
11.2 STRATO Pi I/O Servers
HSYCO runs on two families of dedicated server hardware built on Sfera Labs Strato Pi boards: the Pi family (Base, UPS, CM, CM Duo) and the PRO, ENTERPRISE, and CORE servers. Both families have one thing in common: they come with hardware features, watchdog, buzzer, real-time clock, that HSYCO can only access through a dedicated I/O Server.
There are two separate I/O Servers, one for each hardware family:
-
Strato: for Pi, Pi UPS, Pi CM, and Pi CM Duo
-
StratoPiMax: for PRO, ENTERPRISE, and CORE servers
Both serve the same core purpose: activate the hardware watchdog and expose the server's internal status as datapoints.
WARNING
Without the appropriate STRATO I/O Server configured, the watchdog is not active and built-in hardware features are not fully available. This I/O Server is required for the server to be fully operational.
11.2.1 LED Status Indicators (PRO, ENTERPRISE, CORE)
PRO, ENTERPRISE, and CORE servers have three LED indicators on the front panel that tell you what the server is doing at a glance (Figure 45).
USR LED
The USR (User) LED colour tells you which storage device the server is currently running from.
-
Green blinking: HSYCO is running from the NVMe SSD. This is normal operation.
-
Red blinking: HSYCO is running from the eMMC internal flash. This is fallback mode, which typically means the NVMe could not be accessed during boot.
If you consistently see the red USR LED after a normal startup, investigate the NVMe storage before continuing with your installation.
PWR LED and ACT LED
-
PWR LED — Blue: the server has power supply present. If this LED is off, there is no power.
-
ACT LED — Green flashes: signals eMMC or SD card access, normal during boot and operation.
-
ACT LED — Error pattern: if booting fails, the ACT LED flashes a specific error code that can be decoded using the Raspberry Pi documentation.
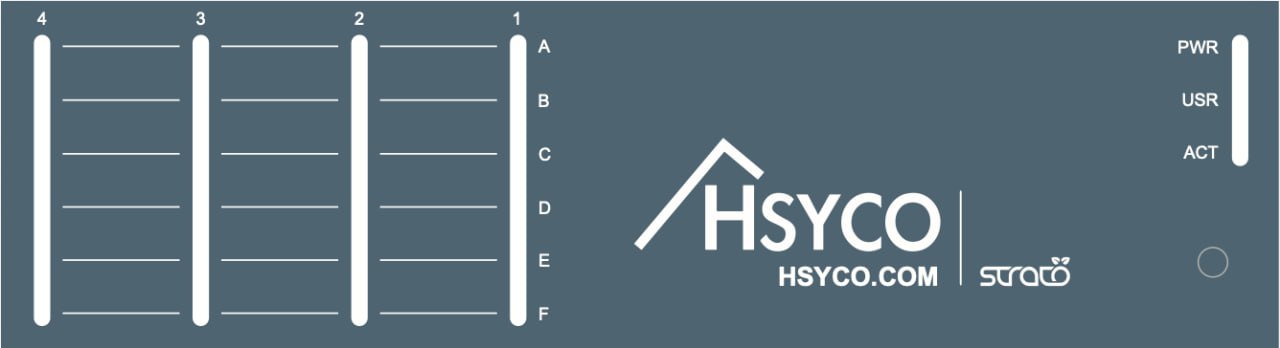
The front-panel status LEDs on a Strato Pi Max based server
11.2.2 Configuring the Strato Pi I/O Server
Adding a STRATO I/O Server takes less than a minute. The steps are identical for both Strato and StratoPiMax.
Step 1: Add the I/O Server
-
Open Manager and go to Settings → I/O Servers.
-
Click Add and choose either Strato (Pi family) or StratoPiMax (PRO/ENTERPRISE/CORE) from the list.
-
HSYCO creates a new entry with default settings (Figure 46).
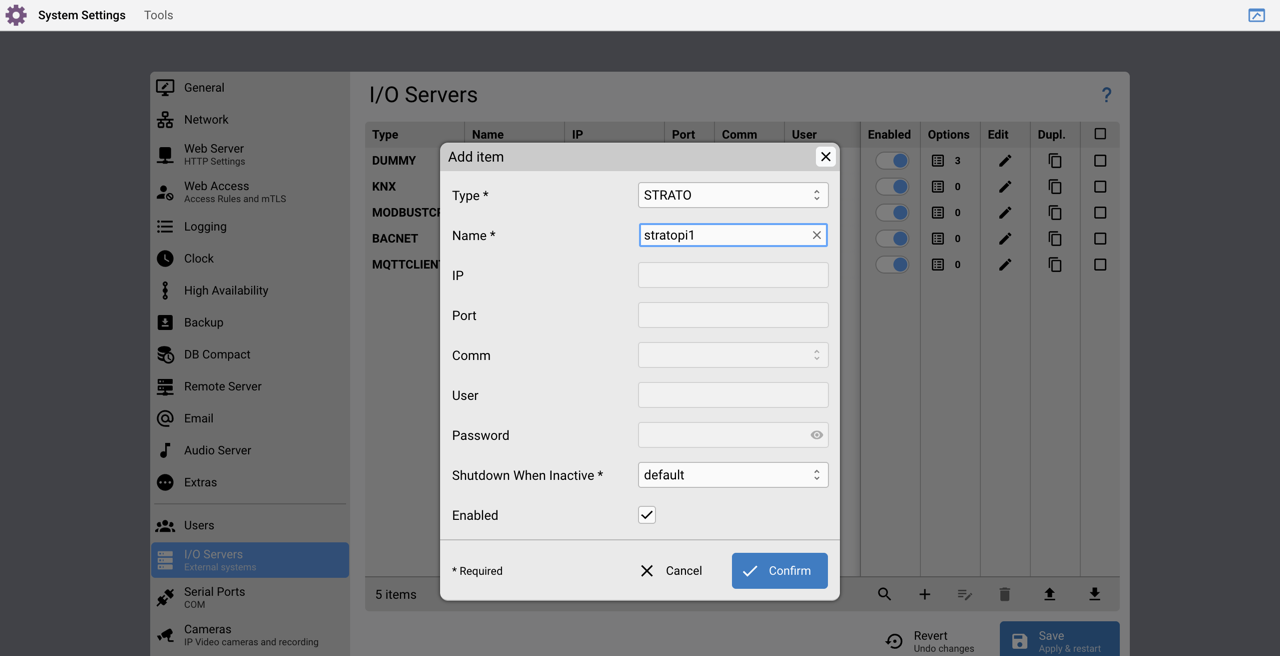
The Strato Pi I/O Server's Settings page
Step 2: Communication Settings (Local Installation)
For a local installation, meaning HSYCO is running on the Strato Pi Max server itself, leave all communication fields blank:
-
IP Address: leave blank
-
Port: leave blank
-
User: leave blank
-
Password: leave blank
Remote installations: The StratoPiMax I/O Server also supports connecting to a remote Strato Pi Max unit over SSH. In that case, enter the IP address, the SSH port (defaults to 22), the username, and the password. The Raspberry Pi OS Kernel module for Strato Pi Max must be installed on the remote unit in both cases. The Strato I/O Server does not support remote connections.
11.2.3 What the I/O Server Monitors
Once configured, both I/O Servers make datapoints available in HSYCO that reflect the live state of the server hardware. These come from the underlying kernel module plus a set of additional datapoints that HSYCO adds directly.
How Kernel Module Datapoints Work
Each readable file exposed by the kernel module appears as a datapoint in HSYCO, using the naming convention <subdir>.<file>:
-
Strato: files under /sys/class/stratopi/ → for example buzzer.status
-
StratoPiMax: files under /sys/class/stratopimax/ → for example buzzer.tone
Write-only command files are not visible in the Status Browser and do not generate events, but can be used in EVENTS rules. For example, if strato is the ID of your I/O Server:
TIME : IO strato.buzzer.beep = "1000 100 3"
This makes the buzzer beep for 1 second (1000 ms), then off for 0.1 (100 ms), three times.
INIT : IO strato.buzzer.beep = 1000, wait = 1,
IO strato.buzzer.beep = 0
This makes the buzzer beep for 1 second, then stops.
Important Datapoints Reference
The StratoPiMax I/O Server exposes many hardware-related datapoints through the kernel module. Some of the most useful are:
| Datapoint | Purpose |
|---|---|
dualfssync.root | Which root file system the server is currently booting from: main (NVMe M.2 SSD) or alt (alternate eMMC flash). |
watchdog.enabled | Enables the hardware watchdog that monitors HSYCO's heartbeat. If HSYCO becomes unresponsive, the watchdog triggers an automatic power cycle to recover the system. |
watchdog.timeout | How long, in seconds, the watchdog waits for a heartbeat from HSYCO before triggering recovery. |
exp_boards.s1_enabled | Controls power to expansion board slot 1. Enable or disable the connected module without restarting. |
exp_boards.s1_enabled_config | The persisted power state for expansion board slot 1, applied on boot. |
usb.usb1_enabled | Controls power to USB port 1. Set to 0 to power down a connected USB device without unplugging it, useful for resetting devices or saving power. |
For a complete reference of all available datapoints, including expansion boards, USB port control, and advanced monitoring options, refer to the Sfera Labs Strato Pi Max documentation on GitHub: https://github.com/ sfera-labs/strato-pi-max-kernel-module.
11.2.4 Recipe: Checking and Adjusting the Fan Thresholds
The StratoPiMax has an internal cooling fan that turns on and off automatically based on the enclosure temperature. You can check the current temperature and adjust when the fan activates.
Step 1: Check the Current Temperature in the Status Browser
-
In Manager, go to Status Browser.
-
Search for your StratoPiMax I/O Server ID (for example
strato). -
Look for these three datapoints:
| Datapoint | What it shows |
|---|---|
strato.fan.temp | Current enclosure temperature |
strato.fan.temp_on | Temperature at which the fan turns on |
strato.fan.temp_off | Temperature at which the fan turns off |
Note: The fan turns on when the temperature reaches fan.temp_on, and turns off when it drops back down to fan.temp_off.
Step 2: Adjust the Fan Thresholds (Optional)
The default turn-on threshold is set by the fan_on_temp option (default: 50°C). The turn-off threshold is automatically 5 degrees lower. You can change these thresholds dynamically by writing to the datapoints from an EVENTS rule — no restart required.
For example, to set the fan to turn on at 45°C and off at 40°C, add this to your EVENTS:
INIT : IO strato.fan.temp_on = 4500,
IO strato.fan.temp_off = 4000
Note: Temperature values are expressed in hundredths of a degree. 50°C = 5000, 45°C = 4500, 40°C = 4000.
The INIT trigger runs the rule once when HSYCO starts, applying your preferred thresholds automatically every time the server boots.