Chapter 8: Data Loggers
The data logger in HSYCO is the tool used to store historical data for any value managed by the system, whether it comes from a datapoint acquired from an external device or from an internal variable generated by automation logic or calculations. This allows building managers and integrators to look back in time, spot consumption patterns, compare periods, and make informed decisions based on real historical data rather than guesswork.
Using a data logger involves four steps. First, you create it in Settings and give it a name and type. Second, you feed it values from EVENTS whenever a datapoint changes. Third, you place a Datalogger object on your page to visualize the results. Fourth, you interact with the chart; switching between time scales, navigating back through history in browser mode, comparing the current period with the previous one, and downloading the data as a CSV or PNG when you need to share or archive it. Once running, HSYCO collects and organizes everything automatically. You can check in at any time and see how your building has been performing, this hour, today, this month, or over the past year, without doing anything extra.
One or more data loggers can be defined in HSYCO. Each data logger stores values in the internal database and automatically organizes them over time, making the data available for charts and CSV import/export operations. Data retention, aggregation, and automatic cleanup policies can be configured in Settings, allowing you to optimize database usage according to your needs.
The HSYCO Datalogger UI object provides advanced visualization features, allowing data to be displayed using different time scales, minute, hour, day, month, or year, with multiple series shown together for comparison and analysis.
HSYCO provides two types of data logger:
-
Counter: designed for cumulative values that only increase over time, such as energy meters (kWh), water meters, or pulse counters. HSYCO automatically calculates the increment for each time period, so charts show actual consumption during the selected interval rather than the continuously growing total.
-
Range: designed for values that vary up and down over time, such as temperature, humidity, pressure, or other analog measurements. HSYCO stores the minimum, maximum, and average for each time period, enabling detailed trend analysis.
8.1 Counter Data Loggers
Use a counter data logger when your source value is cumulative, hence it only increases. The classic example is energy consumption: your energy meter reports the total kilowatt-hours consumed since it was installed. You don't want to chart that ever-growing total; you want to know how many kWh were used in each hour, day, or month. The counter data logger subtracts each new reading from the previous one and records that difference.
8.1.1 Configuring a Counter Data Logger
The configuration settings of the data logger are as follows (Figure 29):
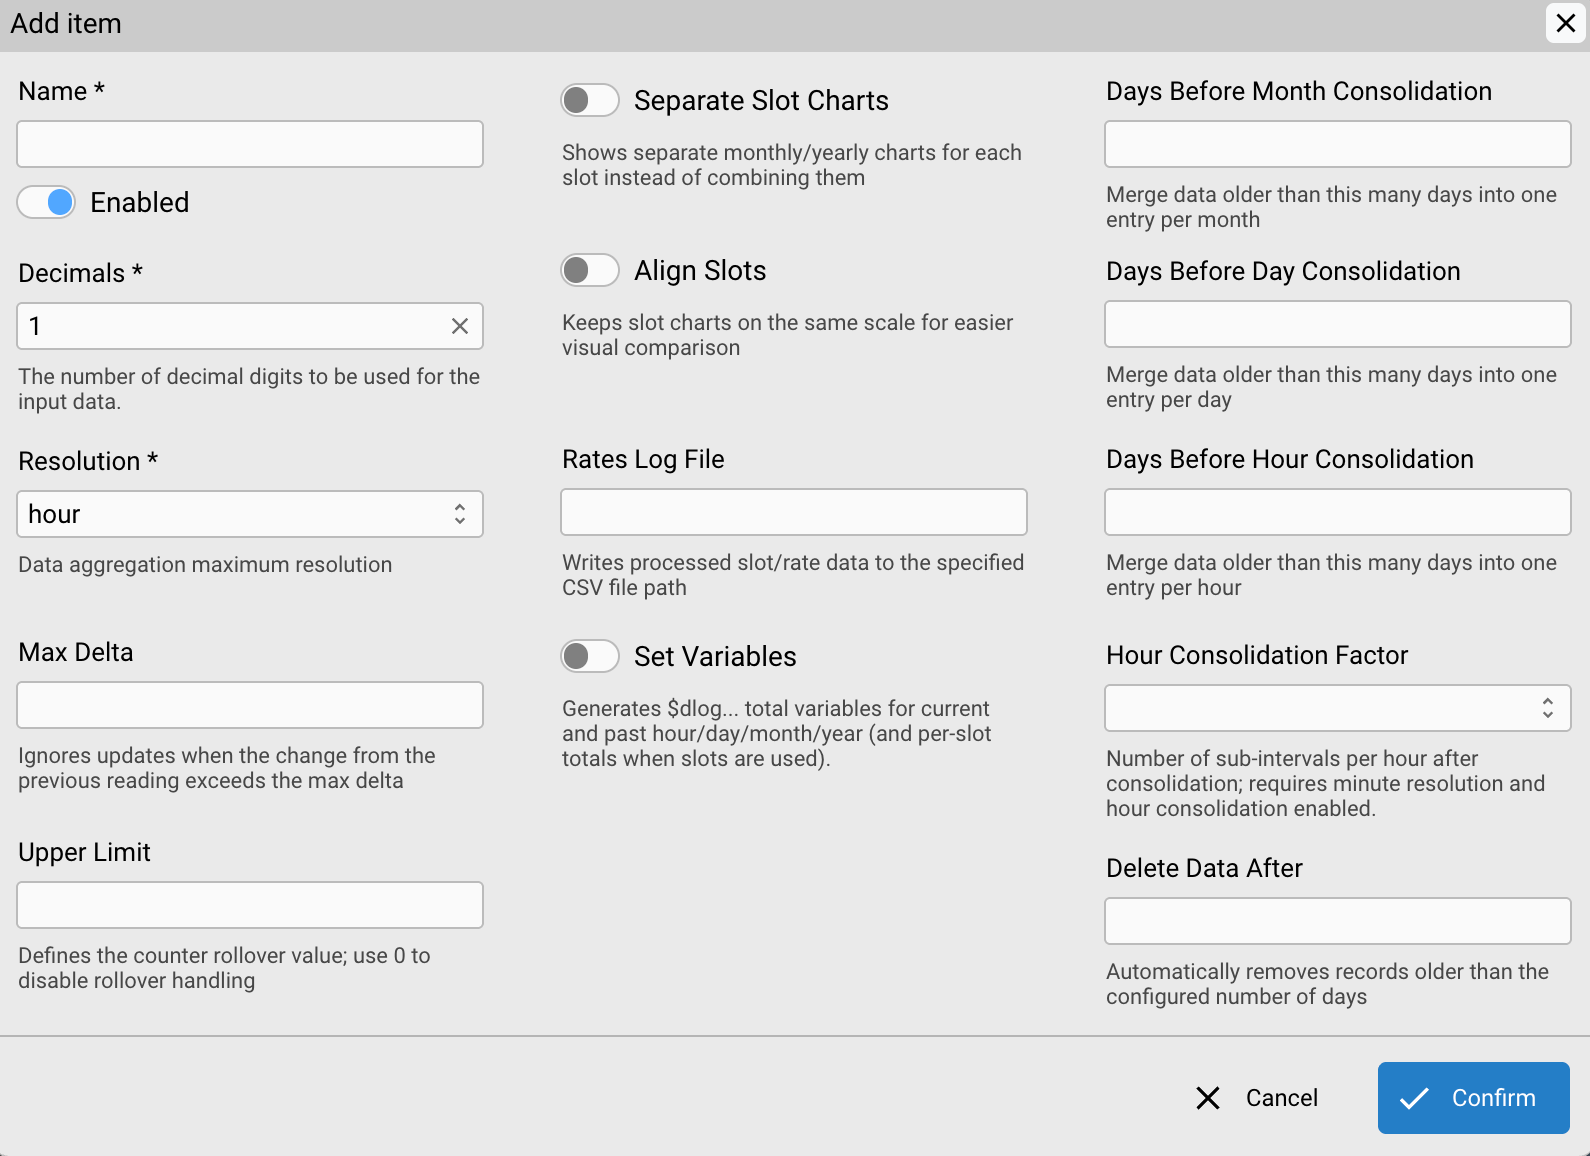
The configuration settings for a counter data logger
| Setting | Description | Default |
|---|---|---|
| Name | A short name with no spaces (e.g. energy). You will use this name in EVENTS. | — |
| Decimals | The number of decimal digits to use for the input data. | 1 |
| Resolution | The finest time bucket: minute, hour, day, or month. For most counters, hour works well. | hour |
| Max Delta | Optional. Ignores any single reading that jumps by more than this amount. Recommended to protect against false readings. | not set |
| Upper Limit | Optional. The maximum value the source counter can reach before it rolls over (resets to zero). Set to 0 if there is no rollover limit. | 0 |
Note on the first reading: A counter logger has nothing to subtract from before its very first reading, so that reading only sets the baseline; it isn't recorded as a delta. Feed the logger 4 values from a fresh start and the recorded total reflects 3 deltas, not 4. This is expected behavior, not a bug, every reading after the first is counted normally.
Set Max Delta: Always set a Max Delta for physical energy meters. If a meter resets or sends a bad reading, without this limit one bad value could corrupt your entire history.
Note on slot features: Separate Slot Charts, Align Slots, and Rates Log File only apply when you configure time-based rate slots (e.g. peak/off-peak energy tariffs). They have no effect on standard counter data loggers without slots. Rate slots are an advanced topic not covered in this book.
Note on data consolidation and deletion: The Settings dialog also includes fields for consolidating old data (merging minute records into hourly, daily, or monthly entries after a set number of days) and for automatically deleting records older than a given age. These are storage management options for long-running installations and are not needed for initial setup. Leave them empty until you have a reason to manage disk space.
8.1.2 Reading Counter Totals in EVENTS (Set Variables)
When you enable Set Variables in the data logger's settings, HSYCO automatically maintains a set of variables you can read directly in EVENTS, no extra code required:
| Setting | Description | Default |
|---|---|---|
| Set Variables | When enabled, HSYCO maintains EVENTS variables with running totals for the current and past hour, day, month, and year (see below). | false |
| Enabled | Uncheck to disable the data logger without deleting it or losing its history. | true |
With Set Variables enabled, HSYCO maintains these variables for a counter data logger (replace <datalogger_id> with the data logger's name):
| Variable | Contains |
|---|---|
$dlog.<datalogger_id>.hour.tot | Total for the current hour |
$dlog.<datalogger_id>.hour.past.tot | Total for the past hour |
$dlog.<datalogger_id>.day.tot | Total for today |
$dlog.<datalogger_id>.day.past.tot | Total for yesterday |
$dlog.<datalogger_id>.month.tot | Total for the current month |
$dlog.<datalogger_id>.month.past.tot | Total for the past month |
$dlog.<datalogger_id>.year.tot | Total for the current year |
$dlog.<datalogger_id>.year.past.tot | Total for the past year |
You can use these variables anywhere in EVENTS, for example, to trigger an alert when daily consumption exceeds a threshold:
$dlog.energy.day.tot > 50 : UISET alert.text = "Daily energy limit exceeded"
Note: Set Variables generates and maintains a large number of variables continuously in the background. Only enable it when you genuinely need to read logger totals back in EVENTS rules. If you just want to display charts, leave it off.
8.1.3 Recipe: Light Switch Counter
-
In Settings → Data Loggers, click + and choose type
counter. -
Fill in the fields:
-
Name: light
-
Type: counter
-
Resolution: minute (to visualize faster the numbers)
-
Max Delta: 100
-
Click Save to save Settings and restart HSYCO.
-
Open the Project Editor.
-
Click Add and choose Datalogger.
-
In the attributes panel, set:
- Dataloggers: add a new entry and set Name to
light, Label to
Light, and Unit to clicks
-
Type: bar
-
Toolbar: dual
-
Click Add and choose Button.
-
Set:
-
Label: Log Click
-
Action: datapoint
-
Datapoint: dummy.light.1
- Open Code Editor, create a new
.txtfile in theeventsfolder, and add:
IO dummy.light.1 : $clickcount + 1
$clickcount : DATALOGGER light = $clickcount
The event is IO dummy.light.1 with no comparison, the transient form from Chapter 6, so it counts every press: the button's datapoint action toggles dummy.light.1, and the transient event fires on both the on and the off transition. Using IO dummy.light.1 = 1 here would count only half the presses.
-
Save the file, the rule is active immediately.
-
Click Run, and press the Log Click several times: you should see in the bar chart the number of times the button was pressed every minute (Figure 30).
Variation: Displaying as a Pie Chart
The same light data logger can be displayed as a pie chart with no changes to Settings or EVENTS. Go back to the Project Editor, select the Datalogger object, and change one attribute:
- Type: pie
Save and run the app (Figure 31). Each slice represents one time period: in this case the current minute and the previous one. The legend shows both the raw count and the percentage share, making it easy to see at a glance which period had the most activity.
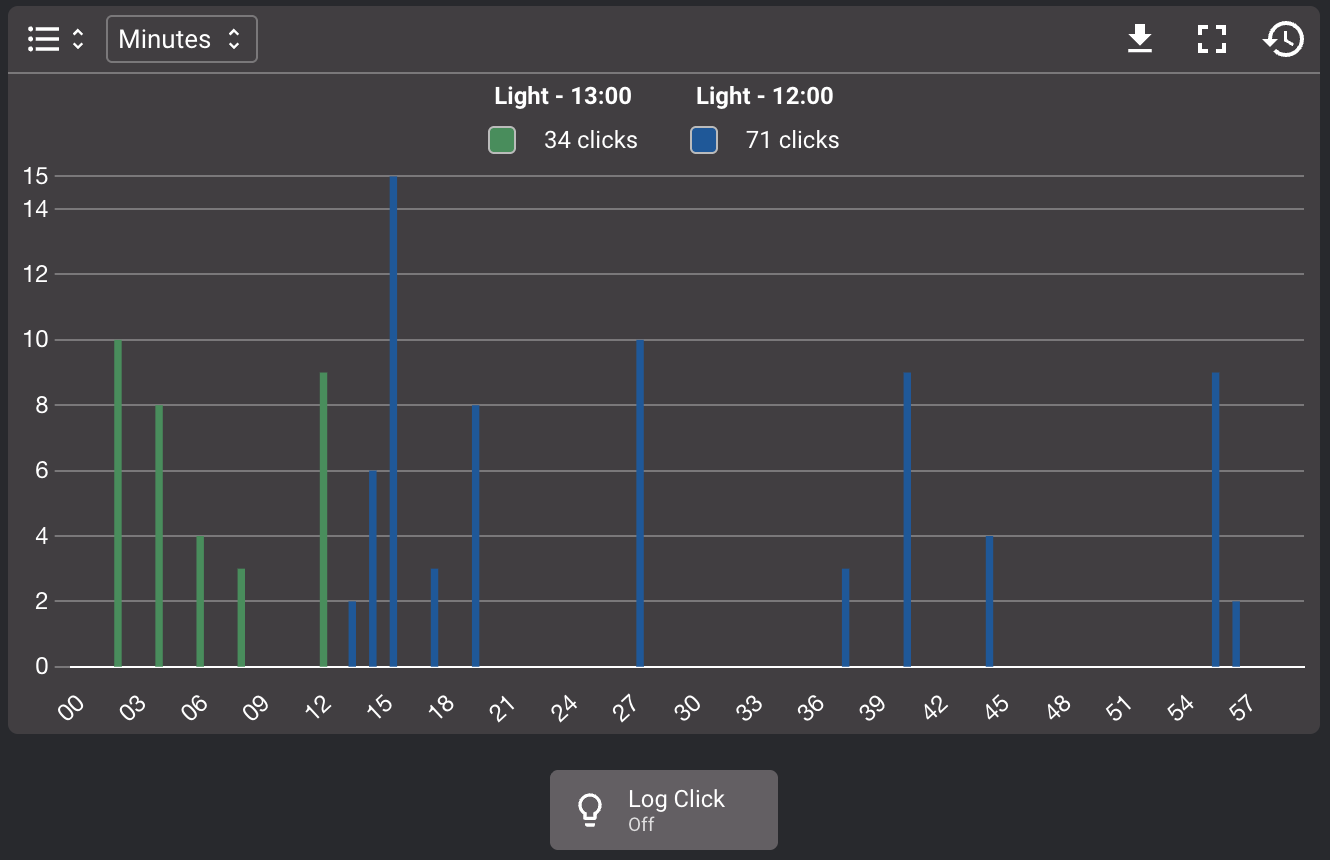
The light switch counter shown as a bar chart
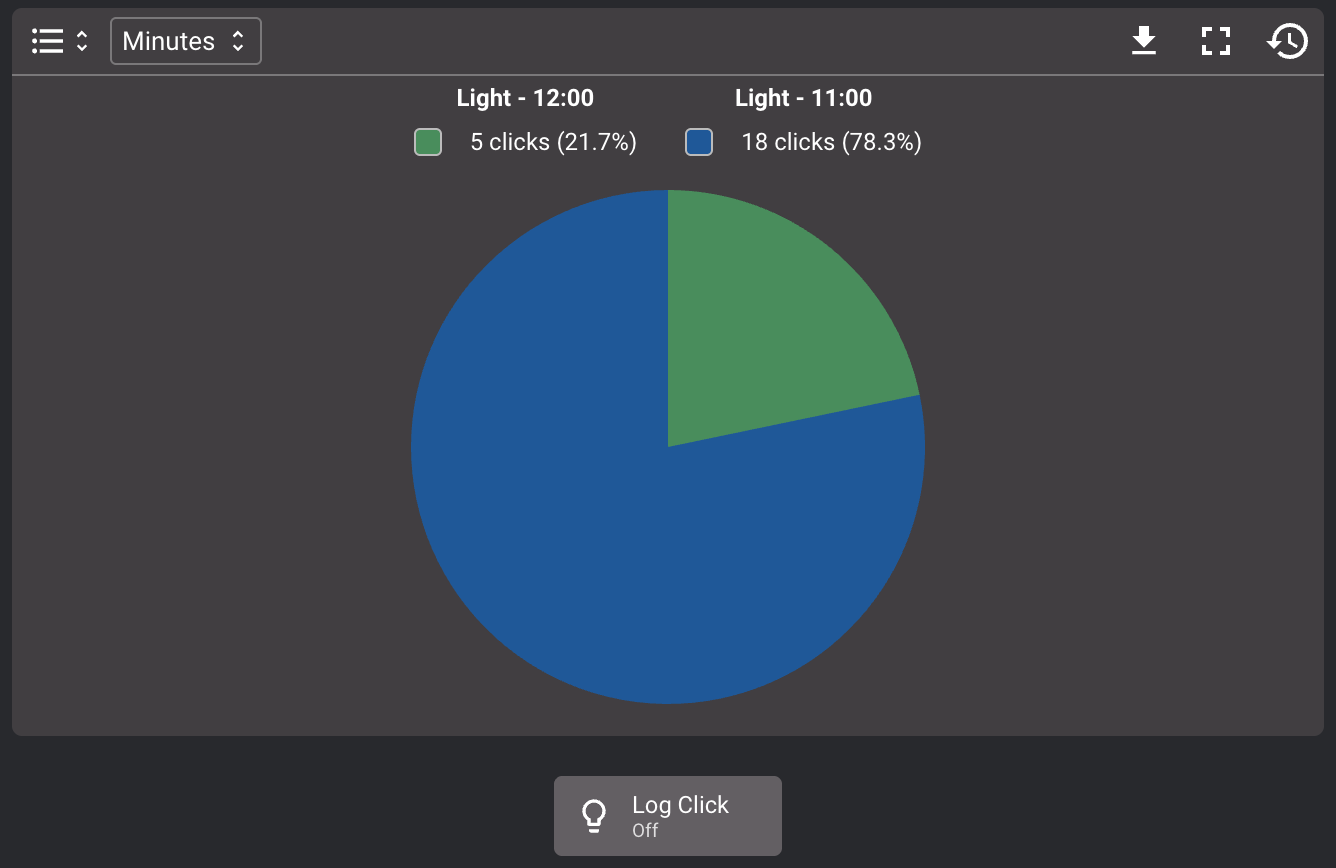
The light switch counter shown as a pie chart
8.2 Range Data Loggers
Use a range data logger when your source value fluctuates; it can go up or down freely. Temperature, humidity, CO₂ levels, and light intensity are all good candidates. For each time period, HSYCO records the minimum, maximum, and average of all the values it received.
8.2.1 Configuring a Range Data Logger
The configuration settings of the data logger are as follows (Figure 32):
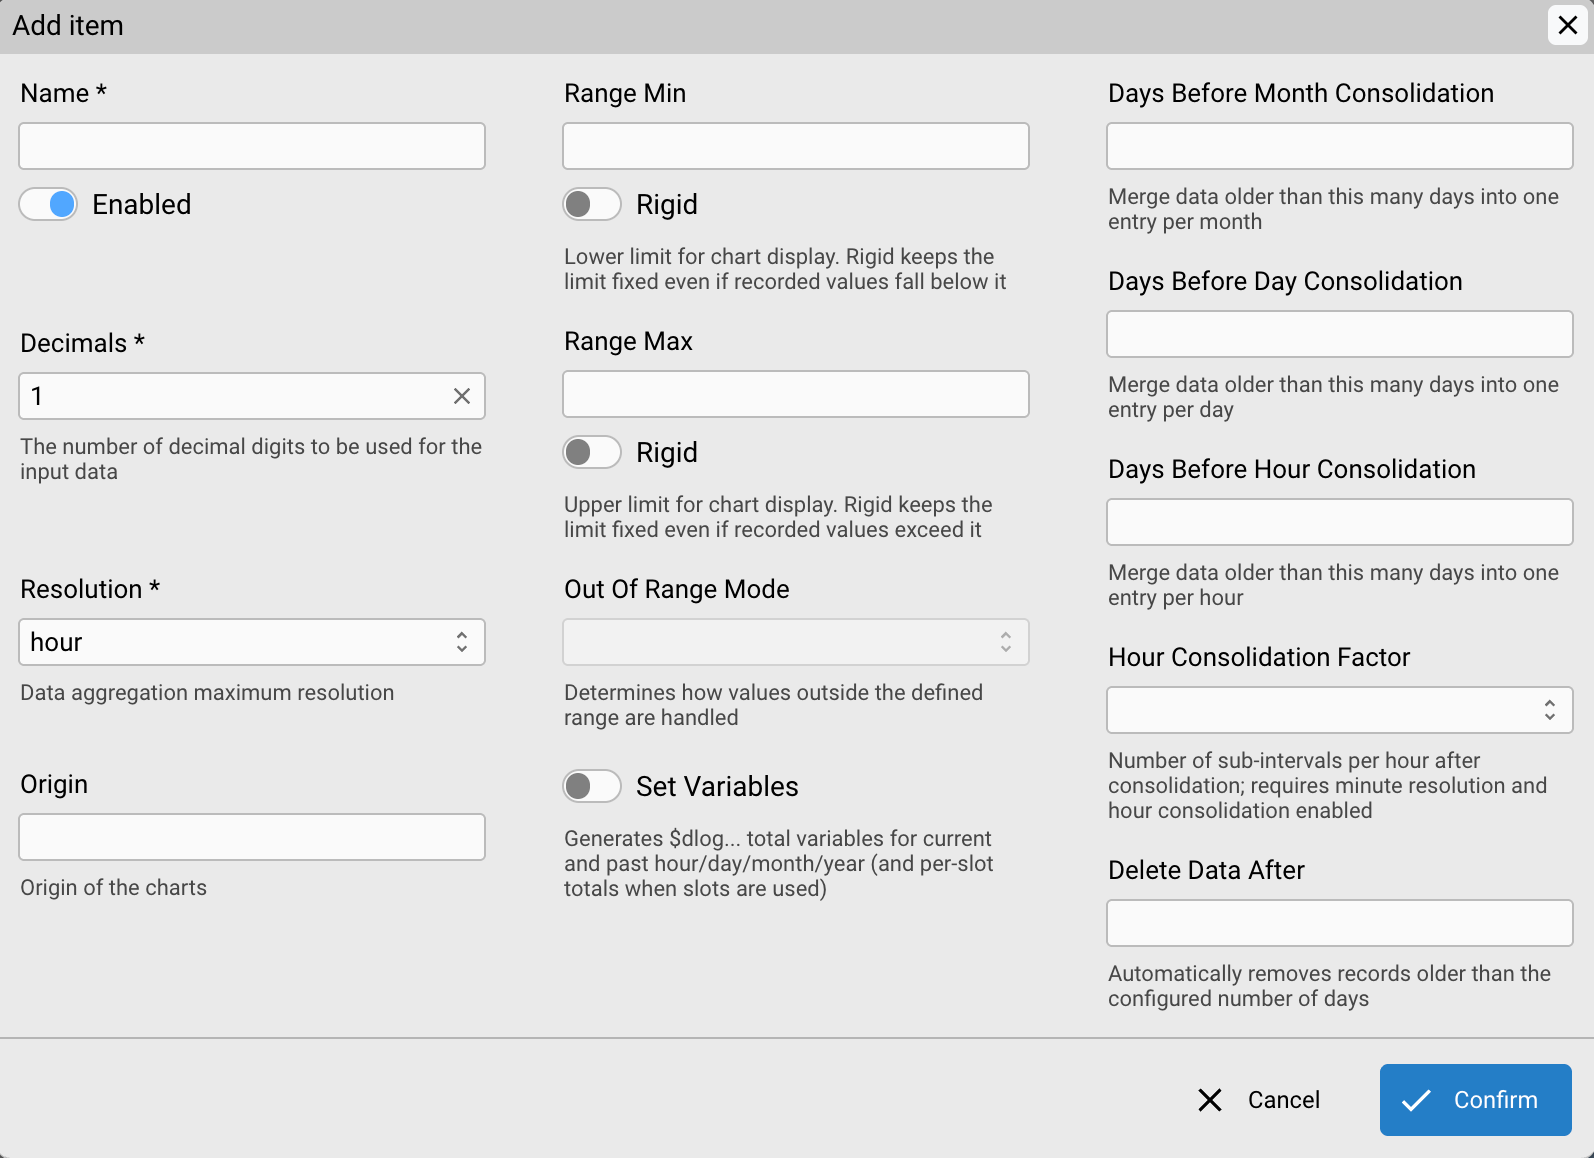
The configuration settings for a range data logger
| Setting | Description | Default |
|---|---|---|
| Name | A short name with no spaces (e.g. temperature). You will use this name in EVENTS. | — |
| Decimals | The number of decimal digits to use for the input data. | 1 |
| Resolution | The finest time bucket: minute, hour, day, or month. | hour |
| Origin | The baseline value for chart display (e.g. set to 0 to show values above and below zero). | 0 |
| Range Min / Max | Optional fixed limits for the chart axis. Leave unset for automatic scaling. | not set |
| Set Variables | When enabled, HSYCO maintains EVENTS variables with running statistics for the current and past hour, day, month, and year (see Section 8.2.2). | false |
| Enabled | Uncheck to disable the data logger without deleting it or losing its history. | true |
Periodic updates for accurate averages: The average is calculated as the sum of values divided by the number of records. To get a meaningful average, send values on a regular schedule; every minute with TIME is a good approach.
Range Min Rigid / Range Max Rigid: Each limit has an optional Rigid toggle, Range Min Rigid and Range Max Rigid, both defaulting to false. When off, that limit adjusts automatically if recorded values fall outside it. When on, the limit stays fixed regardless of the data; useful when you want a consistent scale across time. Rigid only has an effect when the corresponding Range Min or Range Max is set.
Out of Range Mode: Once at least one Rigid limit is set, this option (default cut) decides what happens to a value that falls outside the range: cut adjusts it to the nearest limit, ignore discards it entirely. Either way, HSYCO reports an error for the out-of-range value.
Note on data consolidation and deletion: As with counter data loggers, the Settings dialog includes fields for consolidating old data (merging minute records into hourly, daily, or monthly entries) and for auto-deleting records older than a set number of days. These are storage management options, leave them empty until you need to manage disk space.
8.2.2 Reading Range Statistics in EVENTS (Set Variables)
When you enable Set Variables in a range data logger's settings, HSYCO maintains variables for the minimum, maximum, and average values across each time period (replace <datalogger_id> with the data logger's name):
| Variable | Contains |
|---|---|
$dlog.<datalogger_id>.hour.min.tot | Minimum for the current hour |
$dlog.<datalogger_id>.hour.max.tot | Maximum for the current hour |
$dlog.<datalogger_id>.hour.avg.tot | Average for the current hour |
$dlog.<datalogger_id>.day.min.tot | Minimum for today |
$dlog.<datalogger_id>.day.max.tot | Maximum for today |
$dlog.<datalogger_id>.day.avg.tot | Average for today |
$dlog.<datalogger_id>.month.min.tot | Minimum for the current month |
$dlog.<datalogger_id>.month.max.tot | Maximum for the current month |
$dlog.<datalogger_id>.month.avg.tot | Average for the current month |
$dlog.<datalogger_id>.year.min.tot | Minimum for the current year |
$dlog.<datalogger_id>.year.max.tot | Maximum for the current year |
$dlog.<datalogger_id>.year.avg.tot | Average for the current year |
$dlog.<datalogger_id>.hour.past.min.tot | Minimum for the past hour |
$dlog.<datalogger_id>.hour.past.max.tot | Maximum for the past hour |
$dlog.<datalogger_id>.hour.past.avg.tot | Average for the past hour |
$dlog.<datalogger_id>.day.past.min.tot | Minimum for yesterday |
$dlog.<datalogger_id>.day.past.max.tot | Maximum for yesterday |
$dlog.<datalogger_id>.day.past.avg.tot | Average for yesterday |
$dlog.<datalogger_id>.month.past.min.tot | Minimum for the past month |
$dlog.<datalogger_id>.month.past.max.tot | Maximum for the past month |
$dlog.<datalogger_id>.month.past.avg.tot | Average for the past month |
$dlog.<datalogger_id>.year.past.min.tot | Minimum for the past year |
$dlog.<datalogger_id>.year.past.max.tot | Maximum for the past year |
$dlog.<datalogger_id>.year.past.avg.tot | Average for the past year |
The past-period variables are what let you compare the current period against the previous one, for example, today's average against yesterday's.
Set Variables generates and maintains a large number of variables continuously in the background. Only enable it when you genuinely need to read logger totals back in EVENTS rules. If you just want to display charts, leave it off.
8.2.3 Recipe: Temperature Monitoring Logger
Prerequisite: WXONLINE must be configured and running. See Section 4.6.1 for setup instructions.
-
In Settings → Data Loggers, click + and choose type
range. -
Fill in the fields:
-
Name: temperature
-
Type: range
-
Resolution: hour
-
Origin: 0
-
Click Save to save Settings and restart HSYCO.
-
Open the Project Editor.
-
Click Add and choose Datalogger.
-
In the attributes panel, set:
- Dataloggers: add a new entry and set Name to
temperature,
Label to Temperature, and Unit to °C
-
Type: spline
-
Toolbar: dual
-
Range Values: min,avg,max
-
Min Value Color: #2196F3 (blue)
-
Max Value Color: #F44336 (red)
- Open Code Editor, create a new
.txtfile in theeventsfolder, and add:
IO weather.temp.c OR TIME : DATALOGGER temperature = IO weather.temp.c
- Save the file, HSYCO will start collecting temperature statistics immediately.
Dashboard Mode: All Resolutions at Once
By default the Datalogger object shows one chart at a time. You switch between hour, day, and month using the toolbar. Dashboard Mode changes this: instead of switching, all resolutions are displayed simultaneously, stacked on the same page.
Go back to the Project Editor, select the temperature Datalogger object, and change two attributes:
-
Dashboard Mode: multi
-
Dashboard Resolutions: hour, day, month (Figure 33)
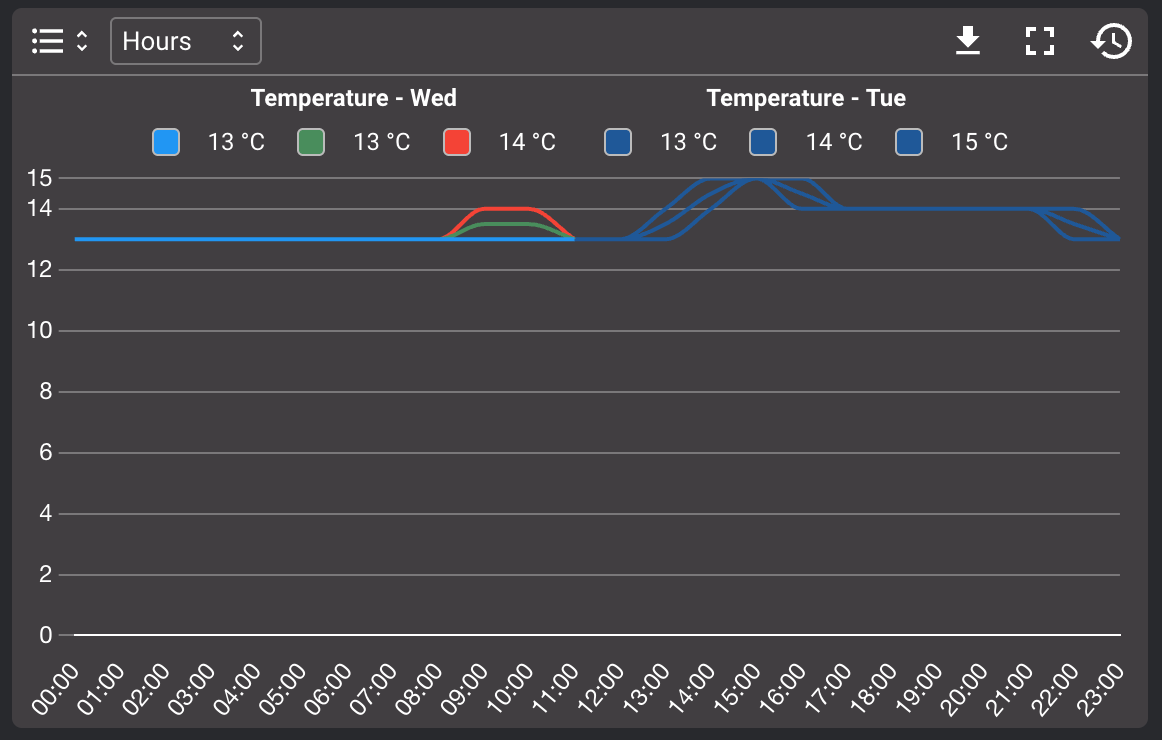
A Datalogger object in dashboard mode showing hour, day, and month resolutions
8.3 Visualizing Multiple Data Loggers Together
Now that both data loggers are running, you can display them side by side on the same page and link them so the interval selector controls both charts at once.
-
Open the Project Editor and create a new page.
-
Add the
lightDatalogger object, resize it to fill the left half of the page, and in the attributes panel set:
- Group: g1
- Add the
temperatureDatalogger object, resize it to fill the right half, and set:
- Group: g1
- Click Save and click Run → Default (Figure 34)
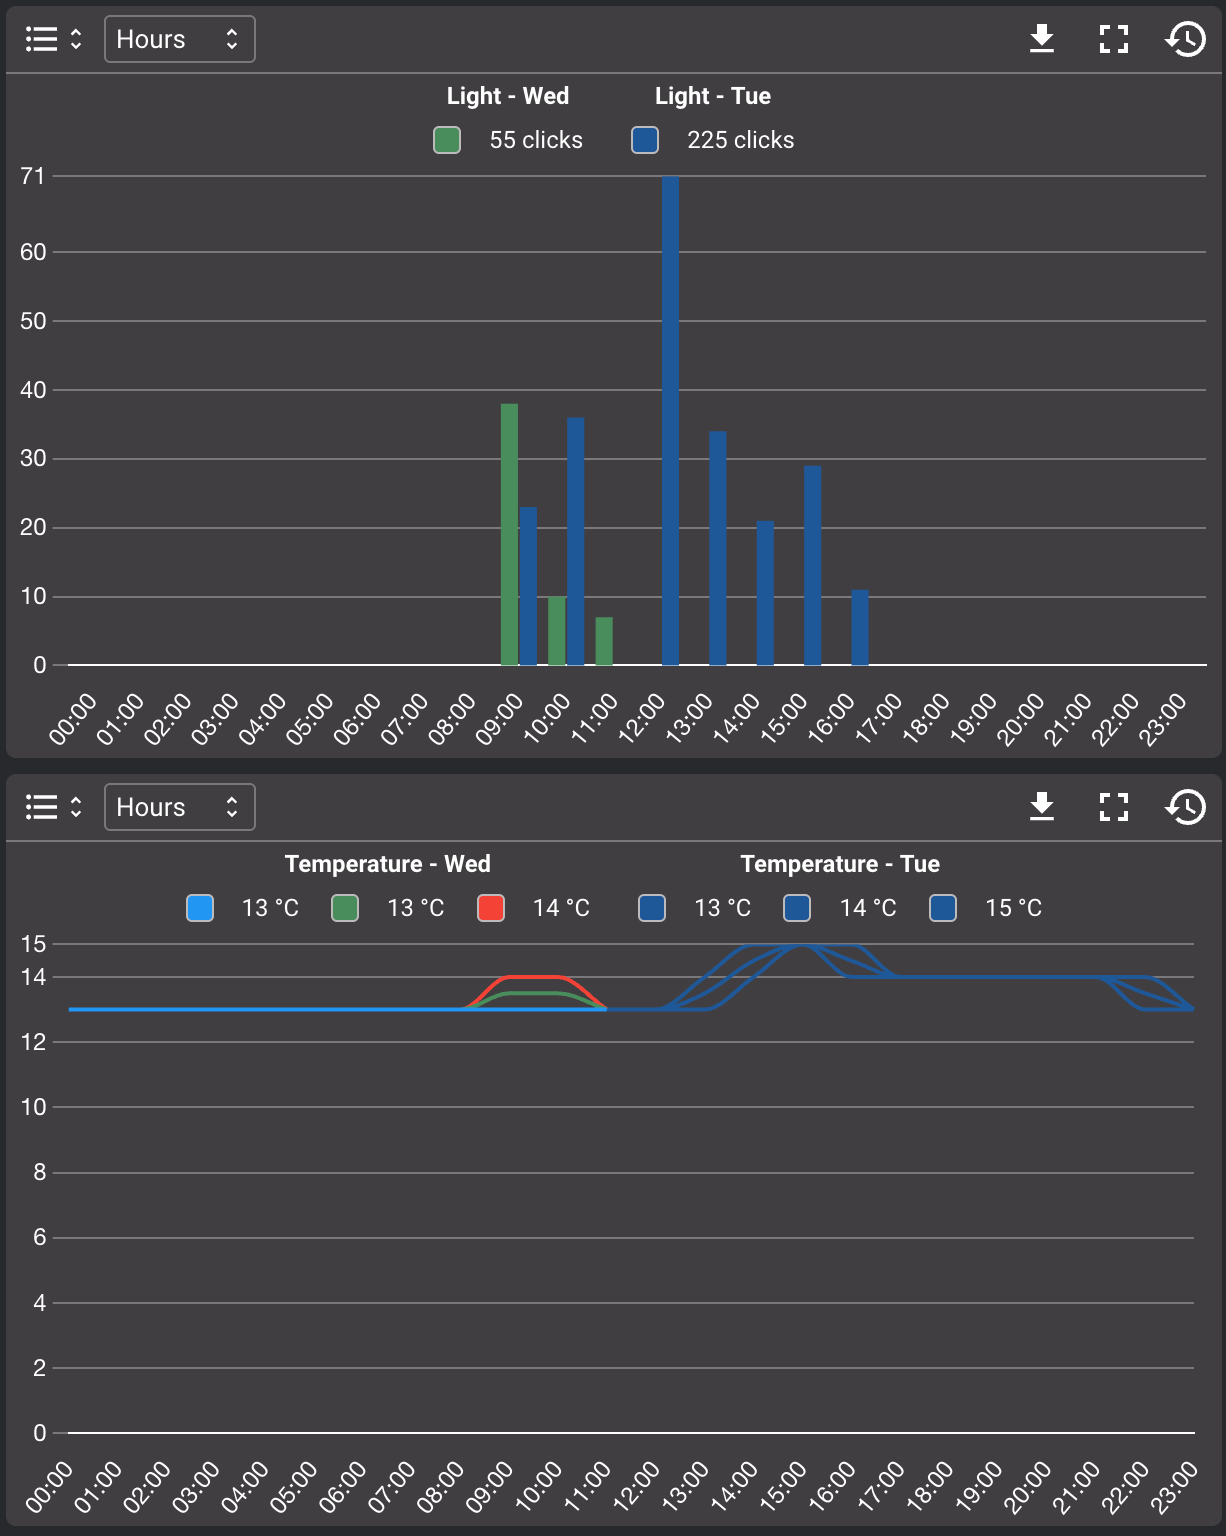
Two Datalogger objects displayed side by side on one page
8.4 Logging to CSV Files
Both counter and range data loggers can write their values to CSV files on disk. This is useful when you need to export data to a spreadsheet, archive readings, or share data with other systems. You do this by adding extra actions to the same DATALOGGER line in EVENTS.
There are two file-logging actions:
-
FILE LOG: appends the most recently processed value to a CSV file. Each call adds one new row. AddTIMESTAMPto include the date and time of each entry. -
FILE STAT: writes the current summary statistics (all processed data) to a file. UnlikeFILE LOG, this overwrites the file each time, giving you a fresh snapshot.
Two more DATALOGGER actions exist outside file logging: DATALOGGER name = CLEAR wipes all data gathered by the logger, and DATALOGGER name = ERROR (counter loggers only) resets the internal delta baseline, useful after manually correcting a bad reading.
Both file-logging actions are added directly to the DATALOGGER line, separated by commas:
IO weather.temp.c OR TIME : DATALOGGER temperature = IO weather.temp.c,
DATALOGGER temperature = FILE LOG userdata/temperature.csv TIMESTAMP,
DATALOGGER temperature = FILE STAT userdata/temperaturestat.csv
The first action feeds the data logger. The second appends a timestamped row to temperature.csv every time a new reading arrives. The third rewrites temperaturestat.csv with the full current statistics.
8.5 Exporting and Importing Raw Data
Beyond FILE LOG and FILE STAT, which write processed, time-bucketed statistics, HSYCO also lets you export and import the full underlying raw data of any data logger. This is useful for backups, migrations, or bulk corrections.
8.5.1 Exporting Raw Data with EVENTS
To export all raw data from a data logger to a CSV file, use FILE CSVWRITE. HSYCO writes a file named <datalogger-id>.csv into the folder you specify:
init : DATALOGGER temperature = FILE CSVWRITE csv
This runs once at startup and writes temperature.csv into the csv folder, containing every raw record stored for that data logger.
You can also export only a specific date range, and optionally group the records by time period:
init : DATALOGGER temperature = FILE CSVWRITE FROM
"202604250000" TO "202604300000" GROUPBY "hour" PATH "csv"
This exports only the records between April 25 and April 30 2026, grouped by hour, into the csv folder. The date and time must be written as a 12- digit string in yyyymmddhhmm format. The TO limit is optional. GROUPBY is also optional; if omitted, every individual record in the time range is written. If GROUPBY is specified, records are combined by year, month, day, or hour. Note that this extended form can write a maximum of 10,000 rows.
You can trigger the export from any EVENTS condition, not just init. For example, trigger it when a user presses a button:
user dataexport : DATALOGGER temperature = FILE CSVWRITE csv
8.5.2 Importing Raw Data with EVENTS
You can also push raw data back into a data logger from a CSV file. Use FILE CSVREAD to selectively insert, update, or delete records, or FILE CSVREADOVER to replace all existing data completely:
user dataimport : DATALOGGER temperature = FILE CSVREADOVER
csv
HSYCO reads temperature.csv from the csv folder, replaces all existing records, and writes result files: a -ok.csv file with successfully processed rows, and a -err.csv file with any rows that had errors (only created if errors exist).
When to use CSVREAD vs CSVREADOVER: Use CSVREAD when you want to update or correct specific records without touching the rest. Use CSVREADOVER when you want to fully replace all historical data, for instance when restoring from a backup.
8.5.3 Chart Navigation
The Datalogger chart supports several interactions for exploring your data:
-
Click on a value to increase the zoom resolution at that point
-
Right-click to go back to the previous zoom level
-
Click and drag across the chart to zoom into that specific time range
-
Mouse wheel to zoom in or out
-
Use the full screen button to expand the chart, with back/forward buttons and a fullscreen toggle for navigating while expanded
-
Date/time fields let you set a specific period to display. The arrow between the two date/time fields copies one period to the other; the
arrows on the sides shift the period forward or backward by its current length
8.5.4 Downloading Data
The Datalogger object includes built-in download buttons. Users can download the visible chart data as a CSV file or export the chart as a PNG image directly from the interface, without any additional configuration.