Status Browser
The Status Browser, allows you to show the real time status of data points, user interface attributes and variables.
Open the Manager and press the Status Browser icon.
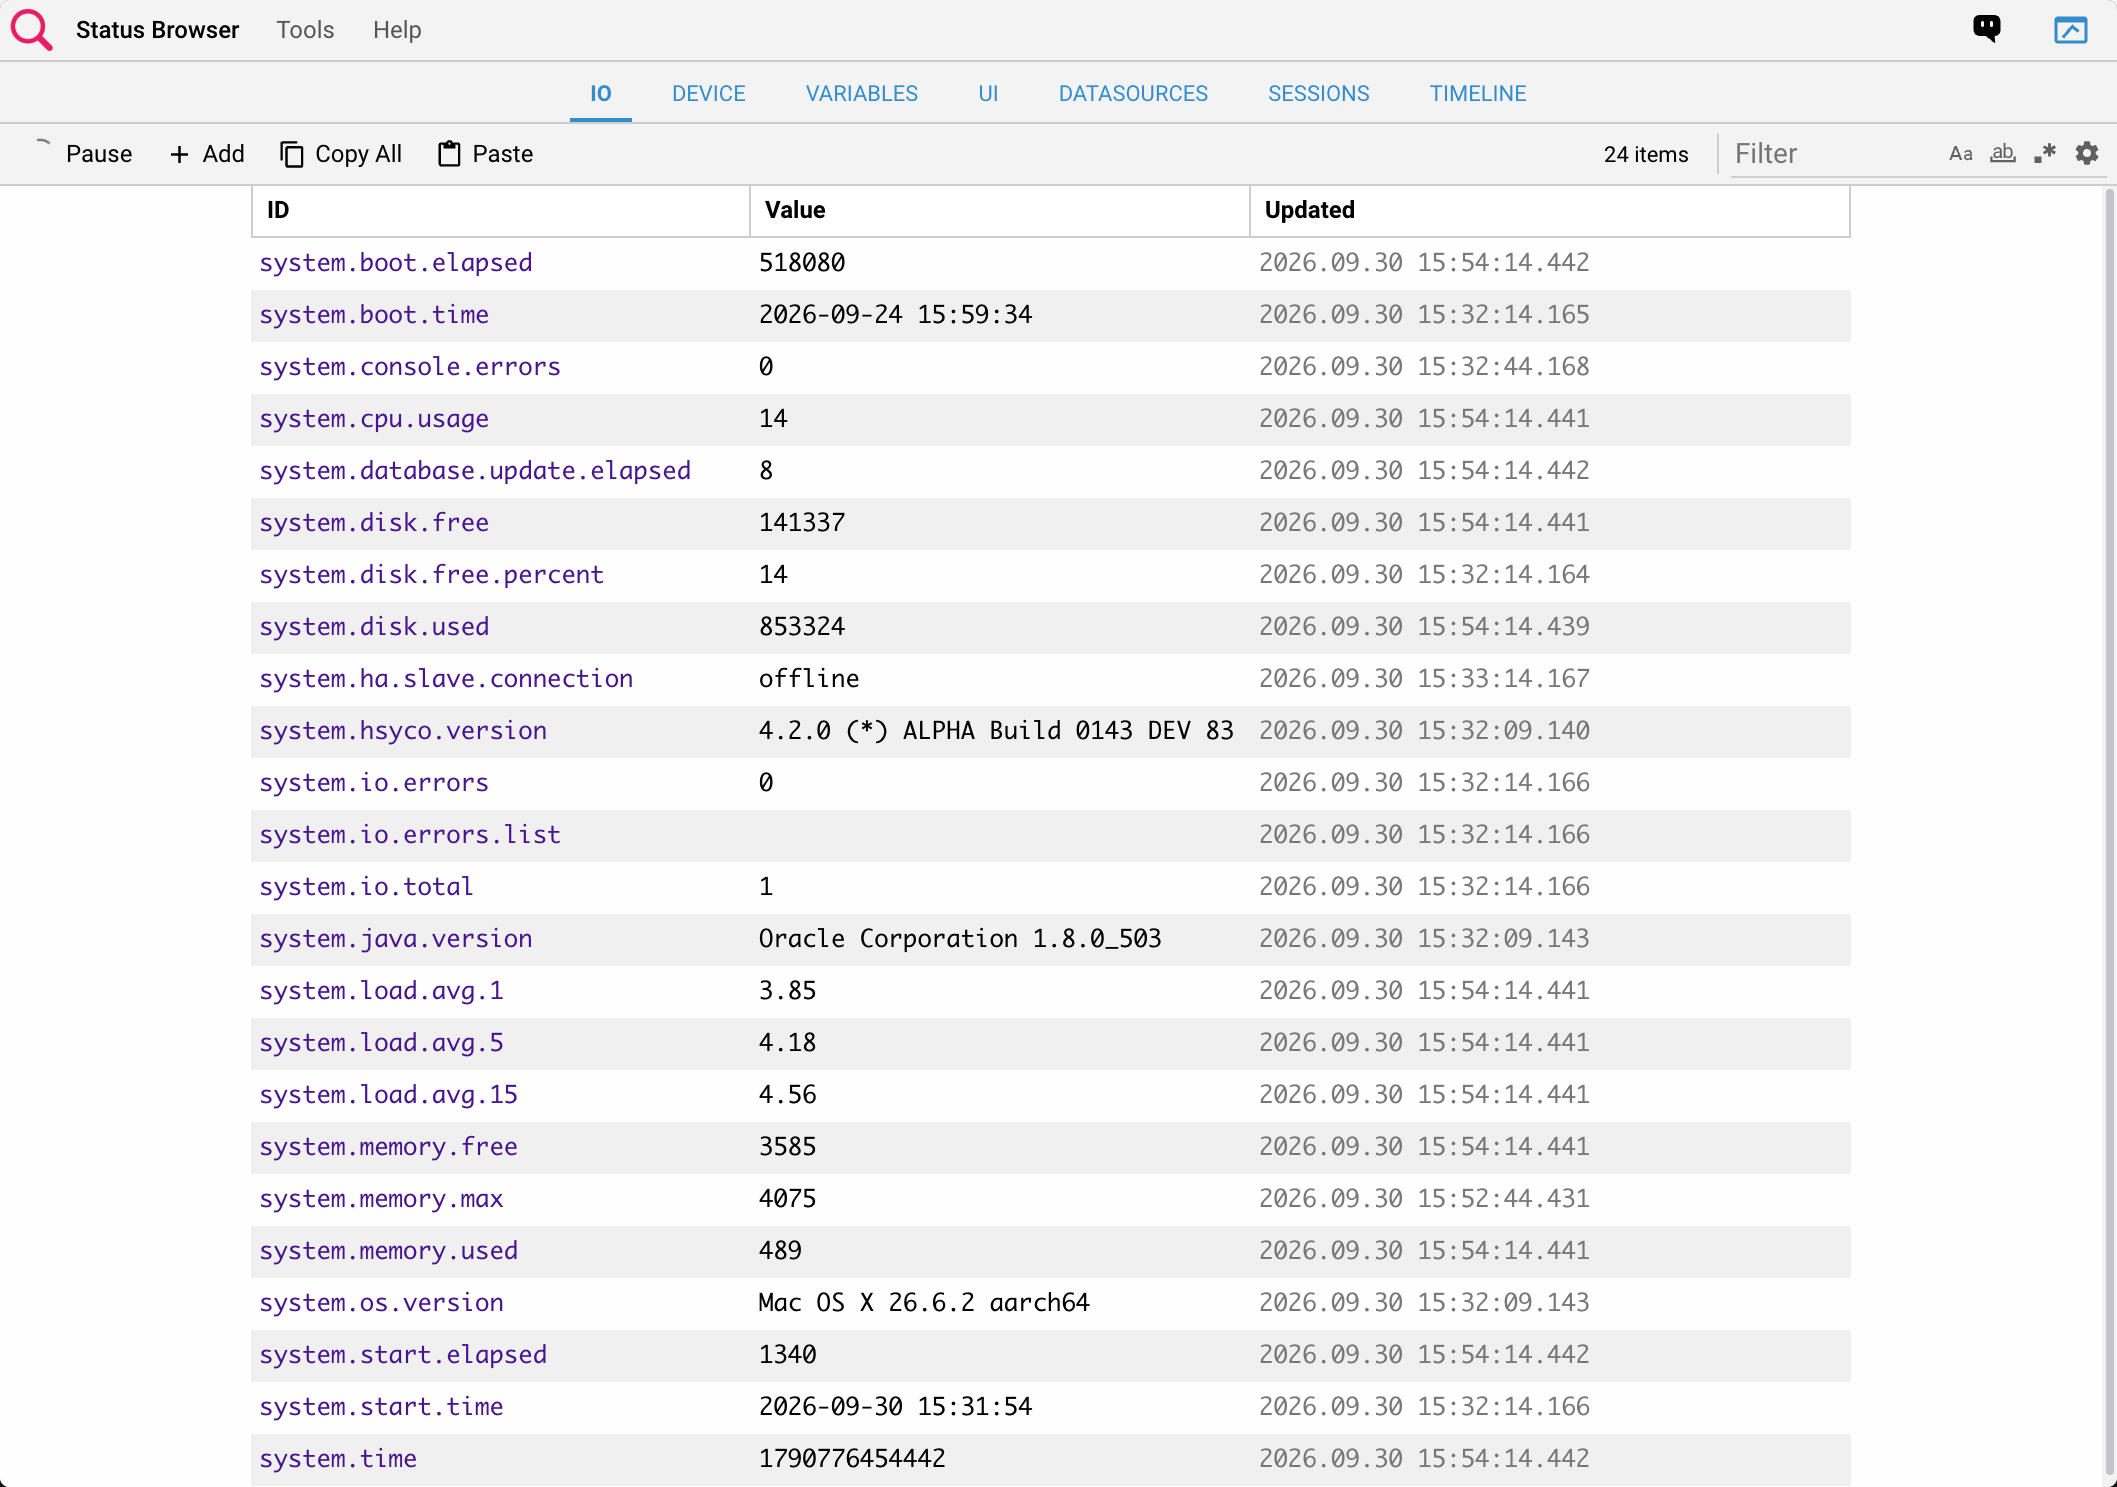
The IO tab shows the real time values of all I/O data points, and the time stamp of each data point last change.
You can pause the real time update, and filter the list by data point name.
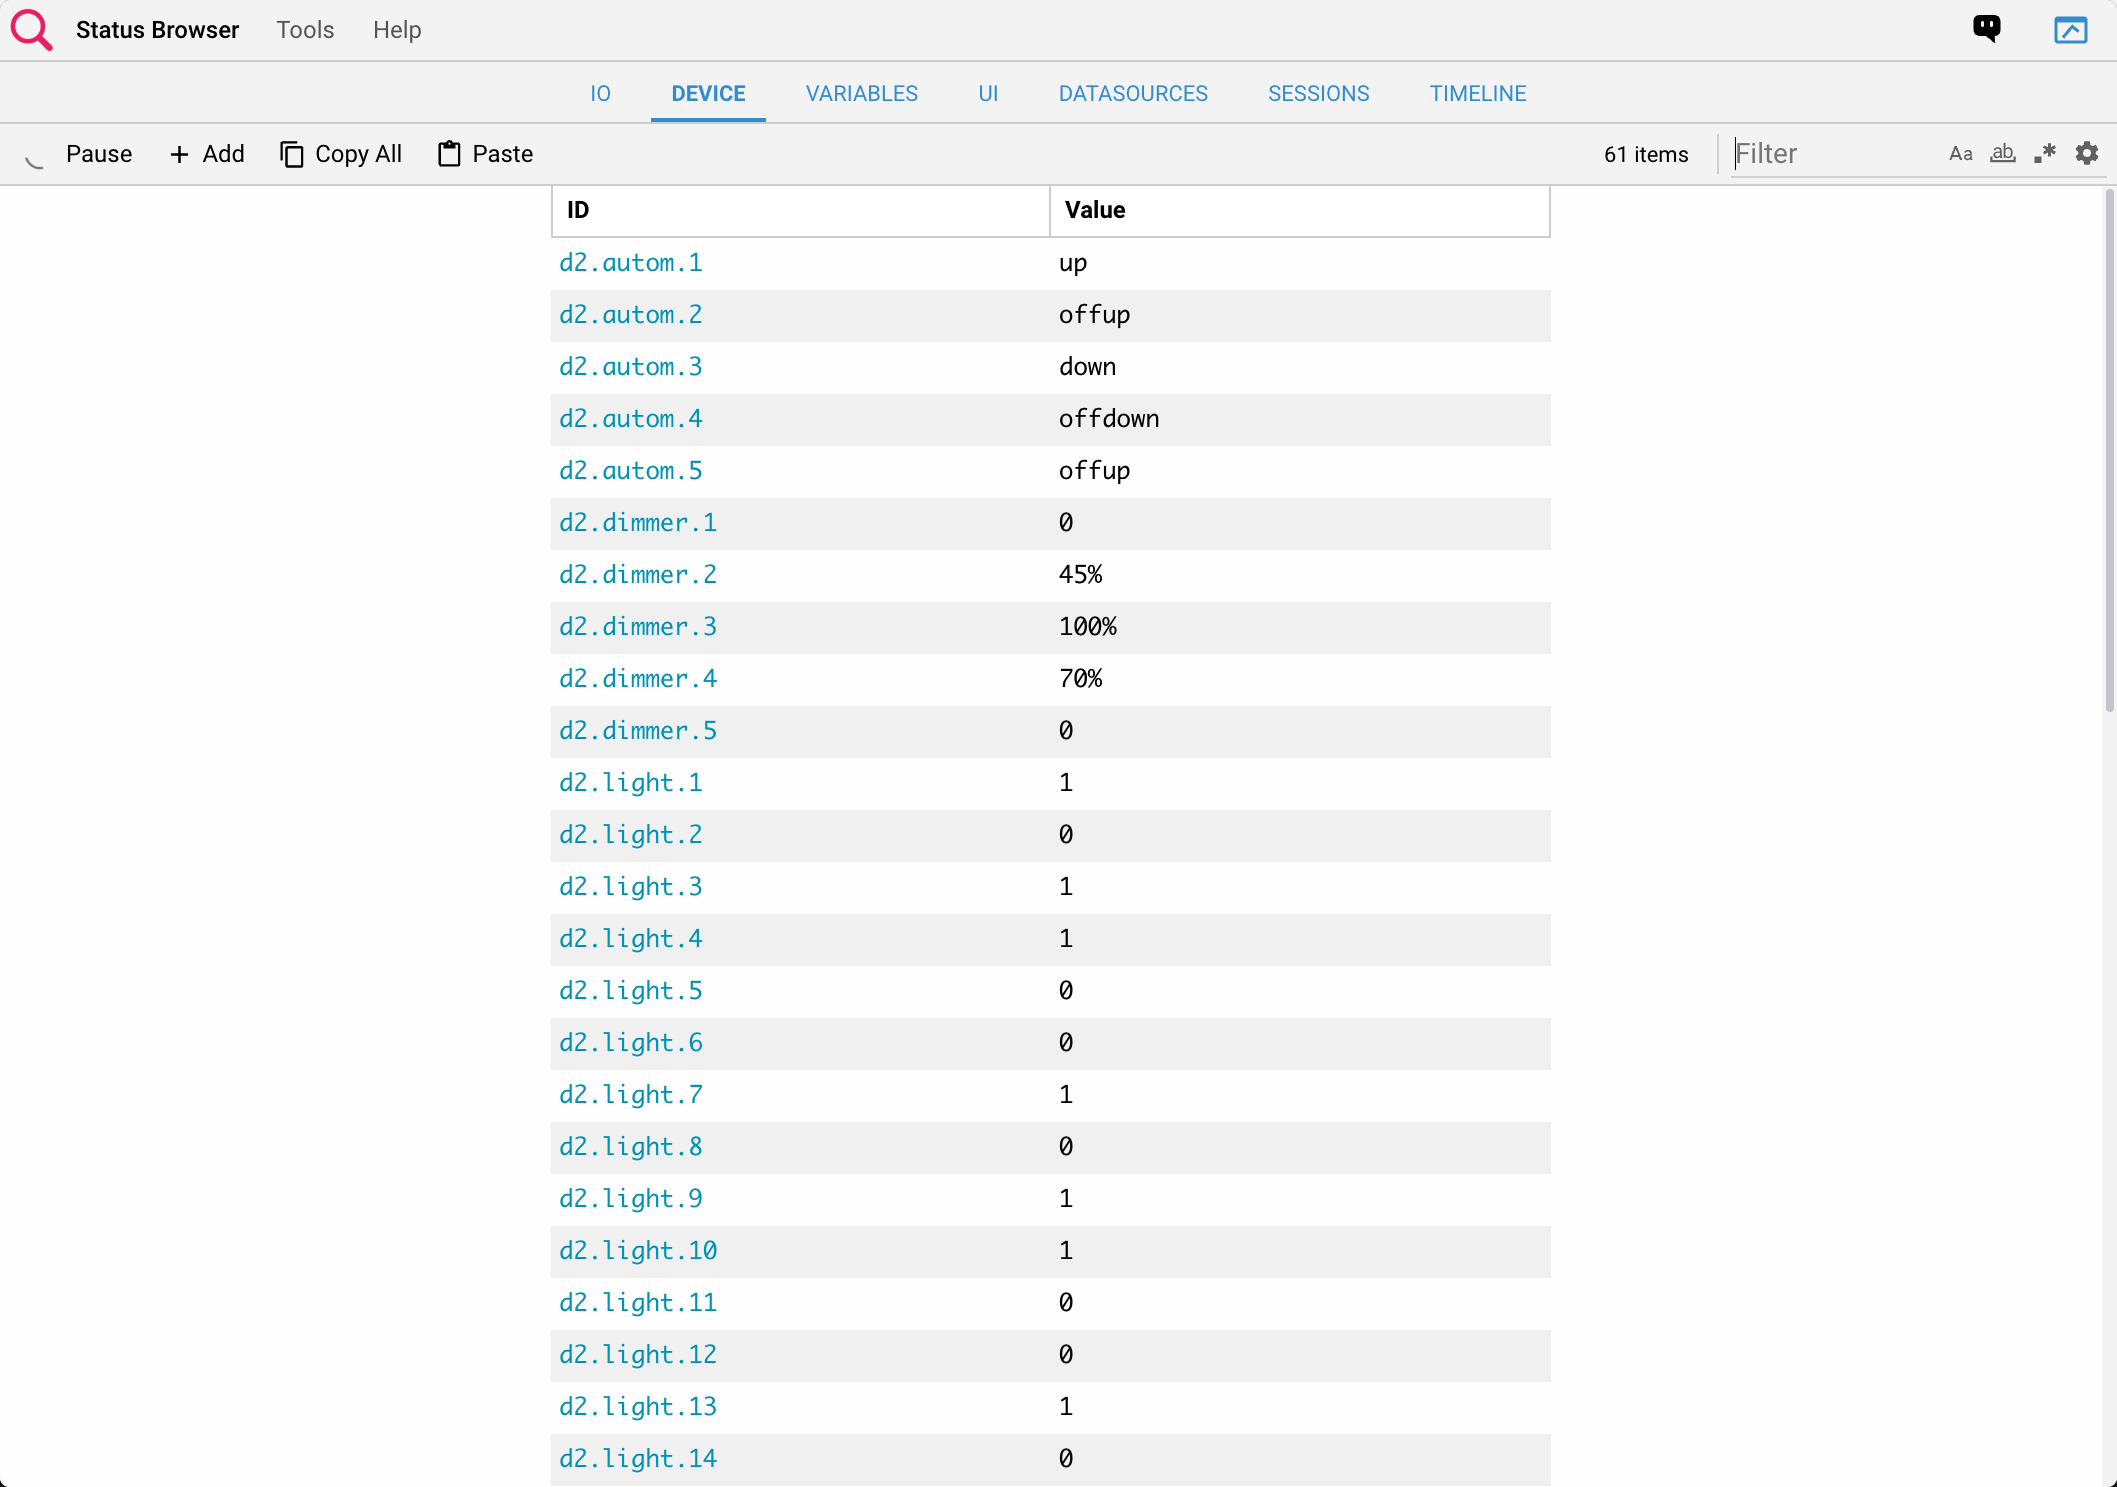
The Device tab shows a list of the the lights, dimmer and automation set by deviceSet().
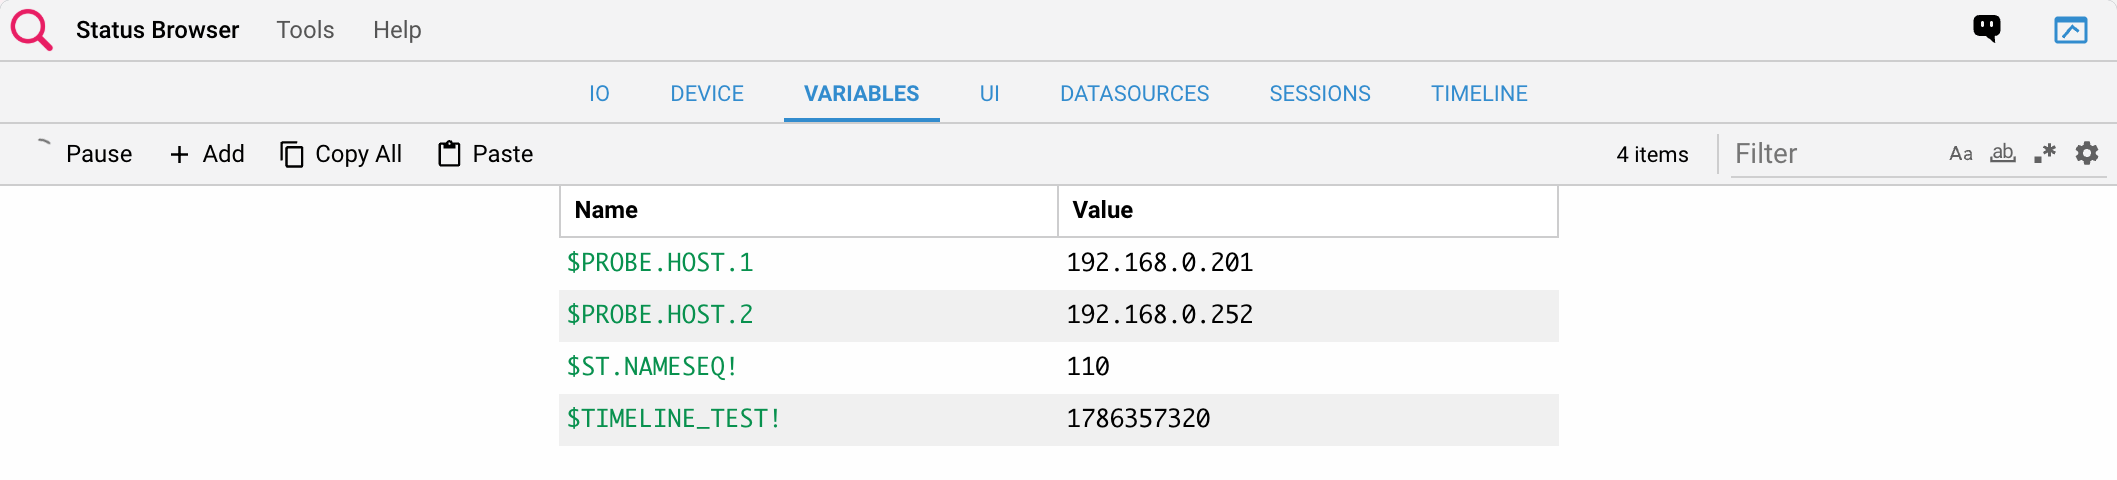
The Variables tab shows all the volatile and persistent variables used by EVENTS/Javascript/Java programming.
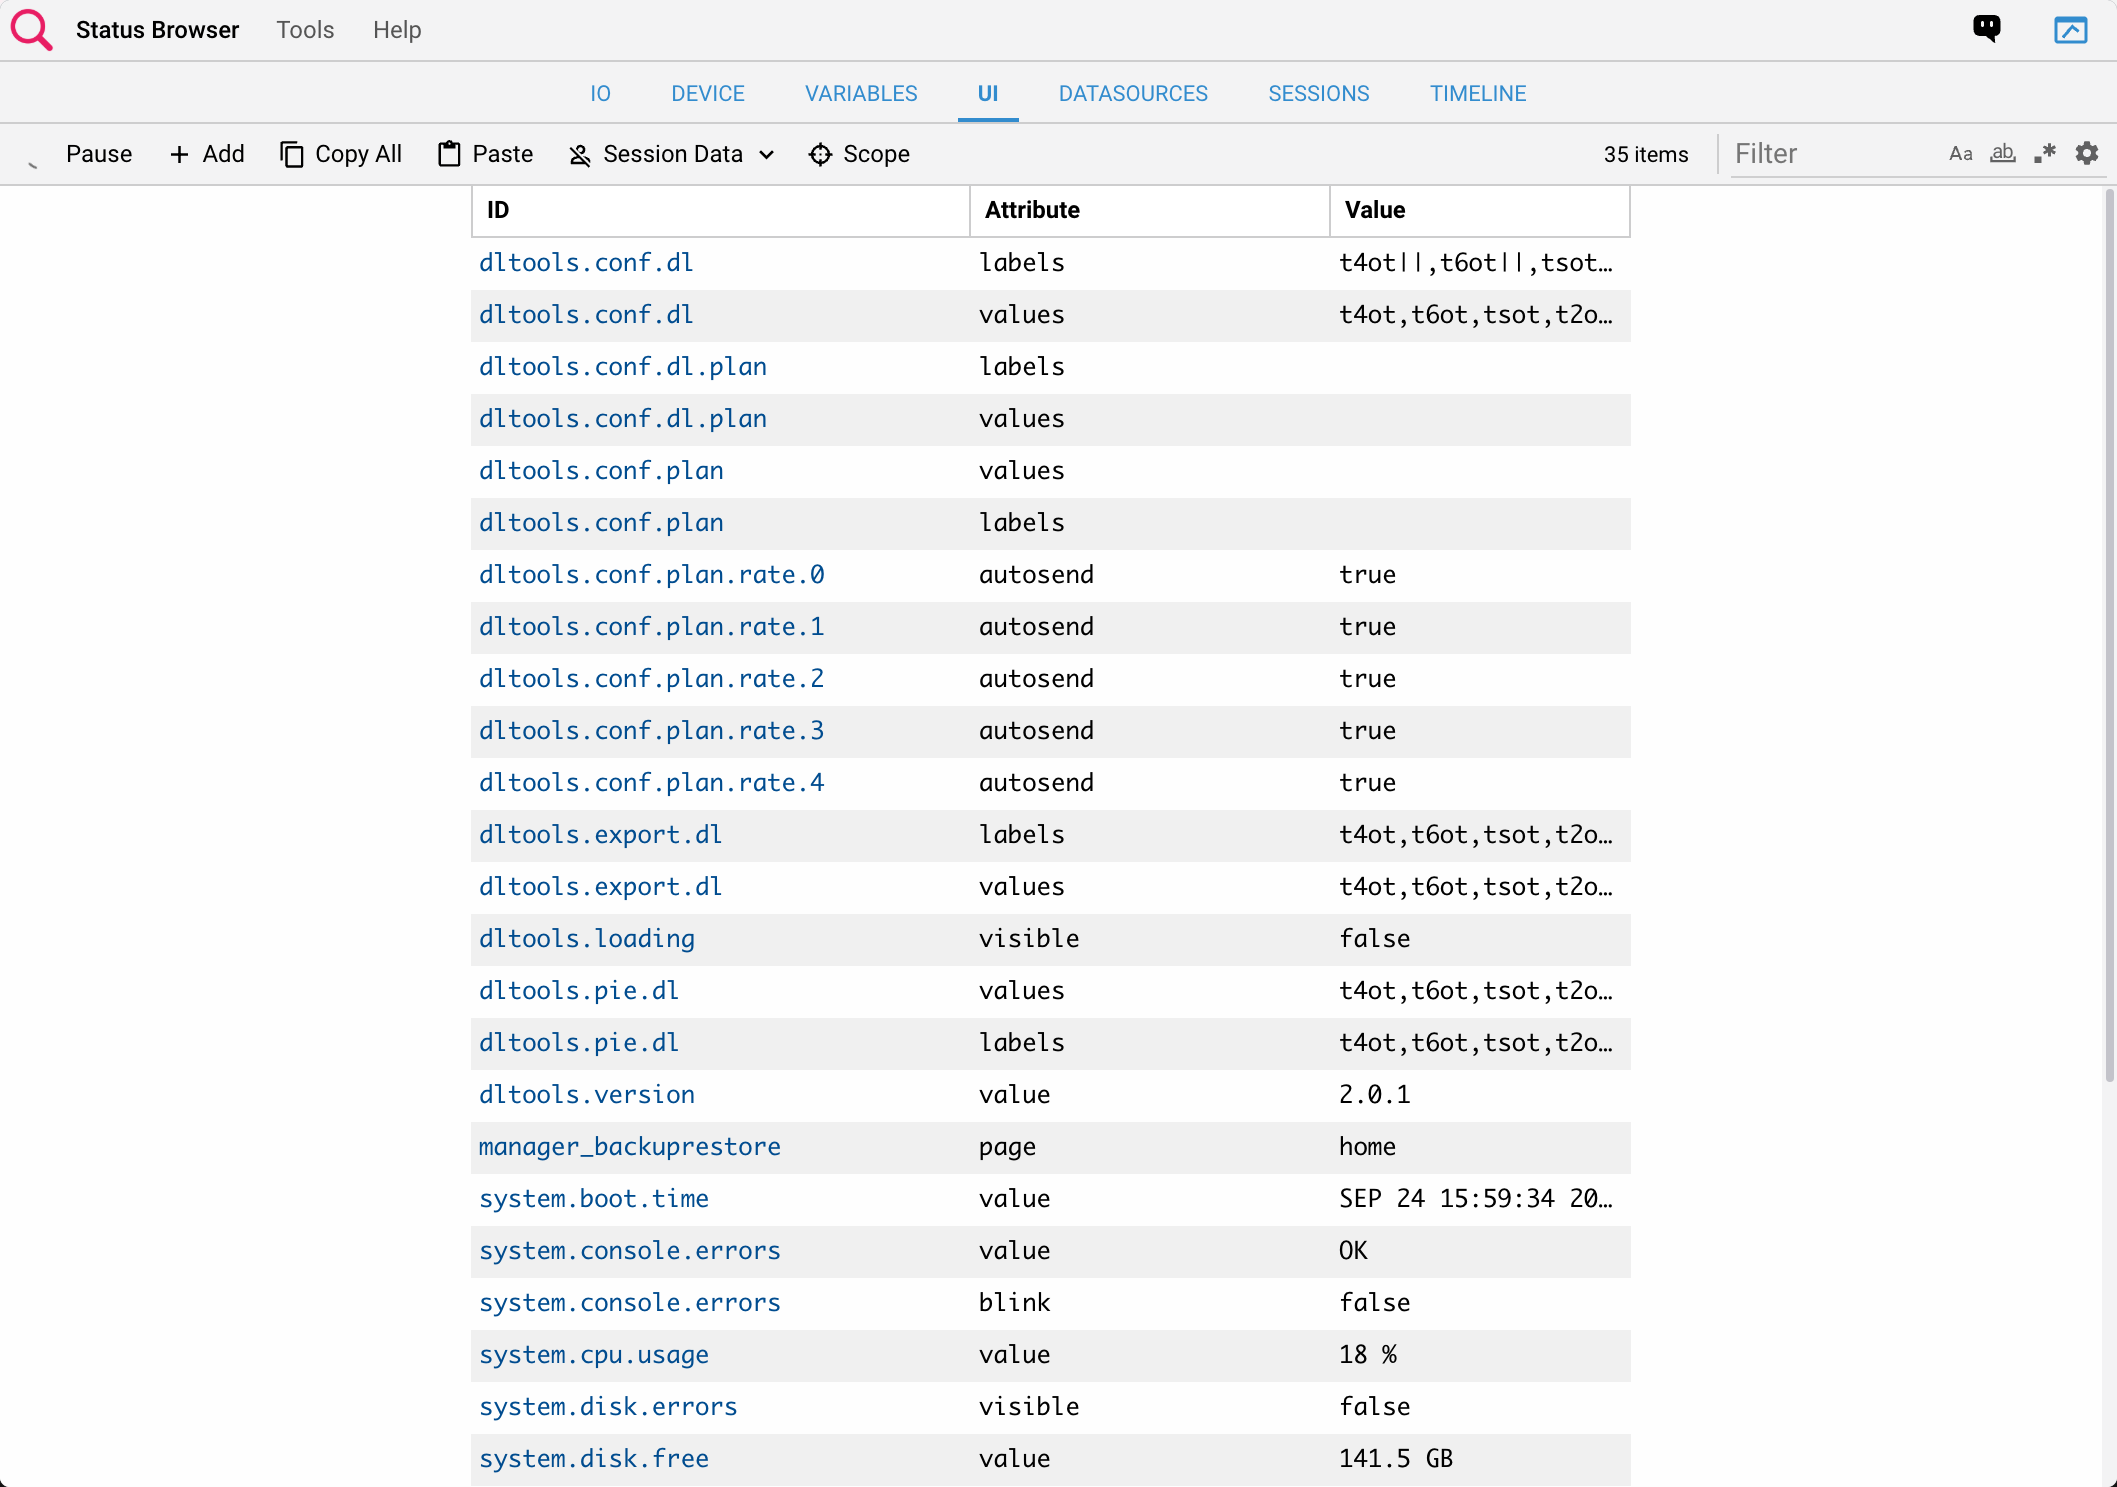
The UI attributes tab shows all user interface ids and attributes with values that have been set with the UISET or uiSet() methods.
The Datasources tab lists the user interface datasources, with the time each one was last refreshed, for example with dataSourceRefresh(). The info button next to a datasource shows its current options.

The Datasource Info popup lists the options of the datasource, as set with dataSourceSQL() and dataSourceOption(), for example the table name and key column of an SQL datasource, and time, the time stamp of its last refresh. Global options are listed under Global; when a session is selected with the Session Data menu, that session's options are listed under Session. The Copy button copies the options as JSON text.
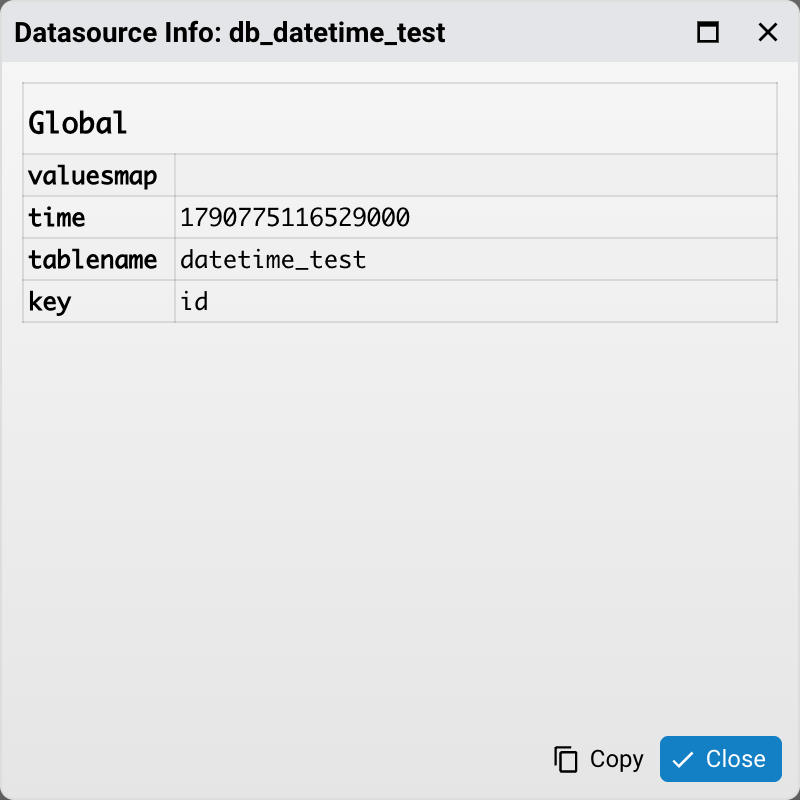
To view session specific attributes and datasources, select a session with the Session Data menu in the UI or Datasources tab, or with the select button in the Sessions tab. The session values are then shown next to the global ones. Select Off in the Session Data menu to hide them.
The Scope button, in the UI and Datasources tabs, shows the state of one or more scopes, entered separated by commas, instead of the unscoped state.
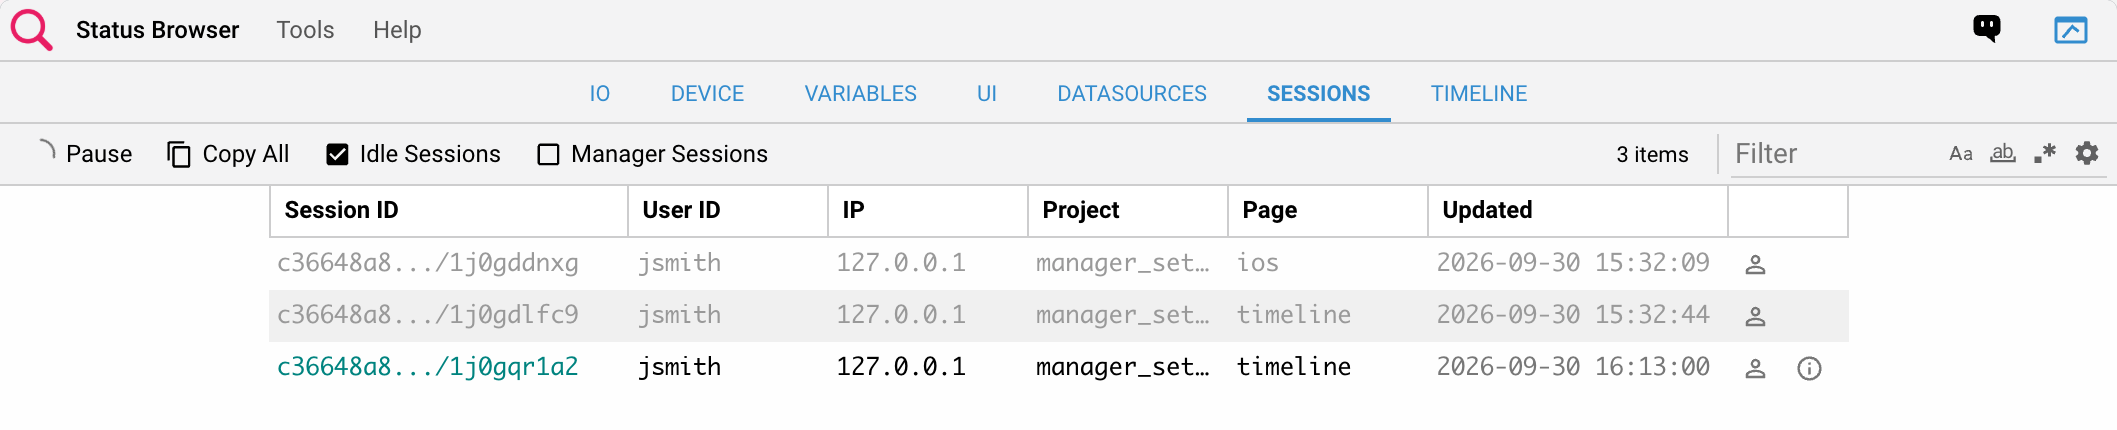
The Sessions tab lists the client sessions of the Web user interface, with the user, IP address, project and page displayed, and the time of the last update. Sessions not updated in the last minute are idle: uncheck Idle Sessions to hide them. Manager sessions are hidden unless you check Manager Sessions. The select button next to a session shows that session's data in the UI and Datasources tabs, and in the Project Editor. For active sessions, the info button displays the client session information.
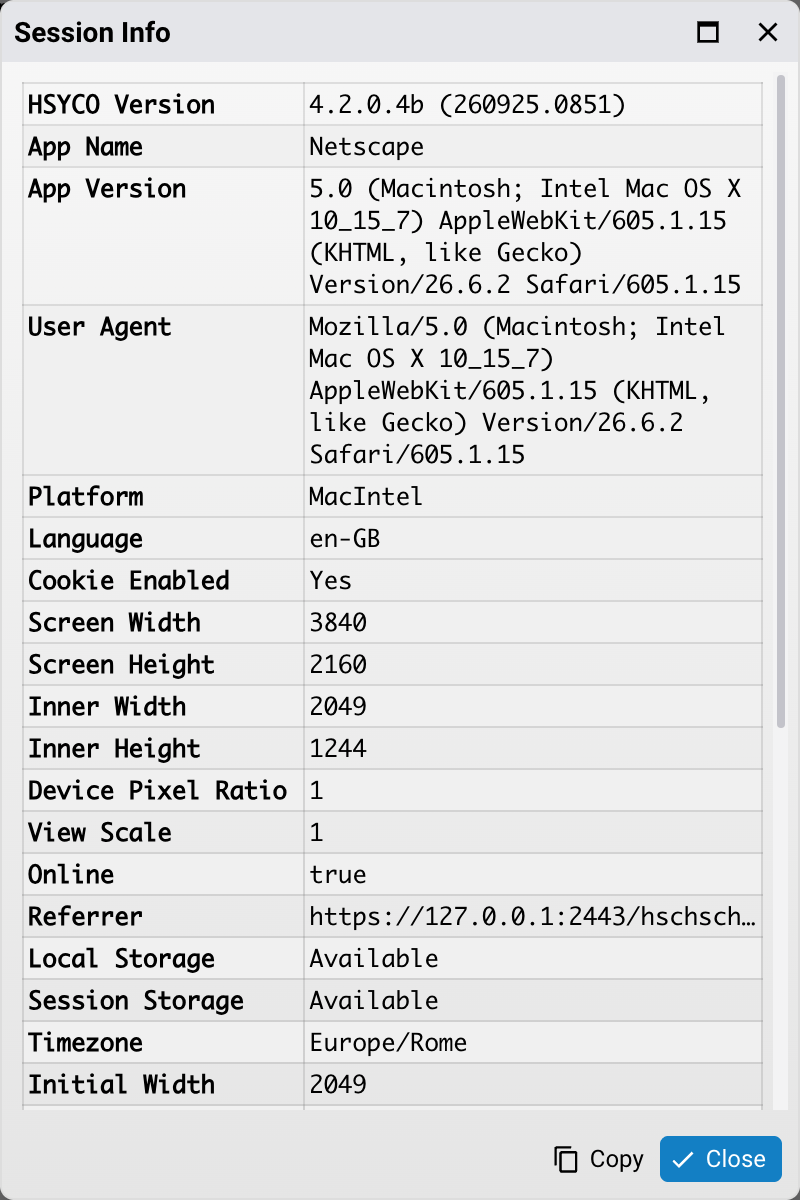
The Session Info popup shows the information reported by the client itself: the HSYCO client version, the browser's user agent, platform and language, the screen and window size, the device pixel ratio, the time zone, the current URL, the start time, the loading times and any client errors. It is useful to diagnose problems with a specific browser or device. The Copy button copies the information as JSON text.
Timeline tab
The Timeline tab lists all the events recorded in the Timeline, across data points, commands and variables, newest first. The columns are Time, Type (IO, Command or Variable), Name, Value and Origin.
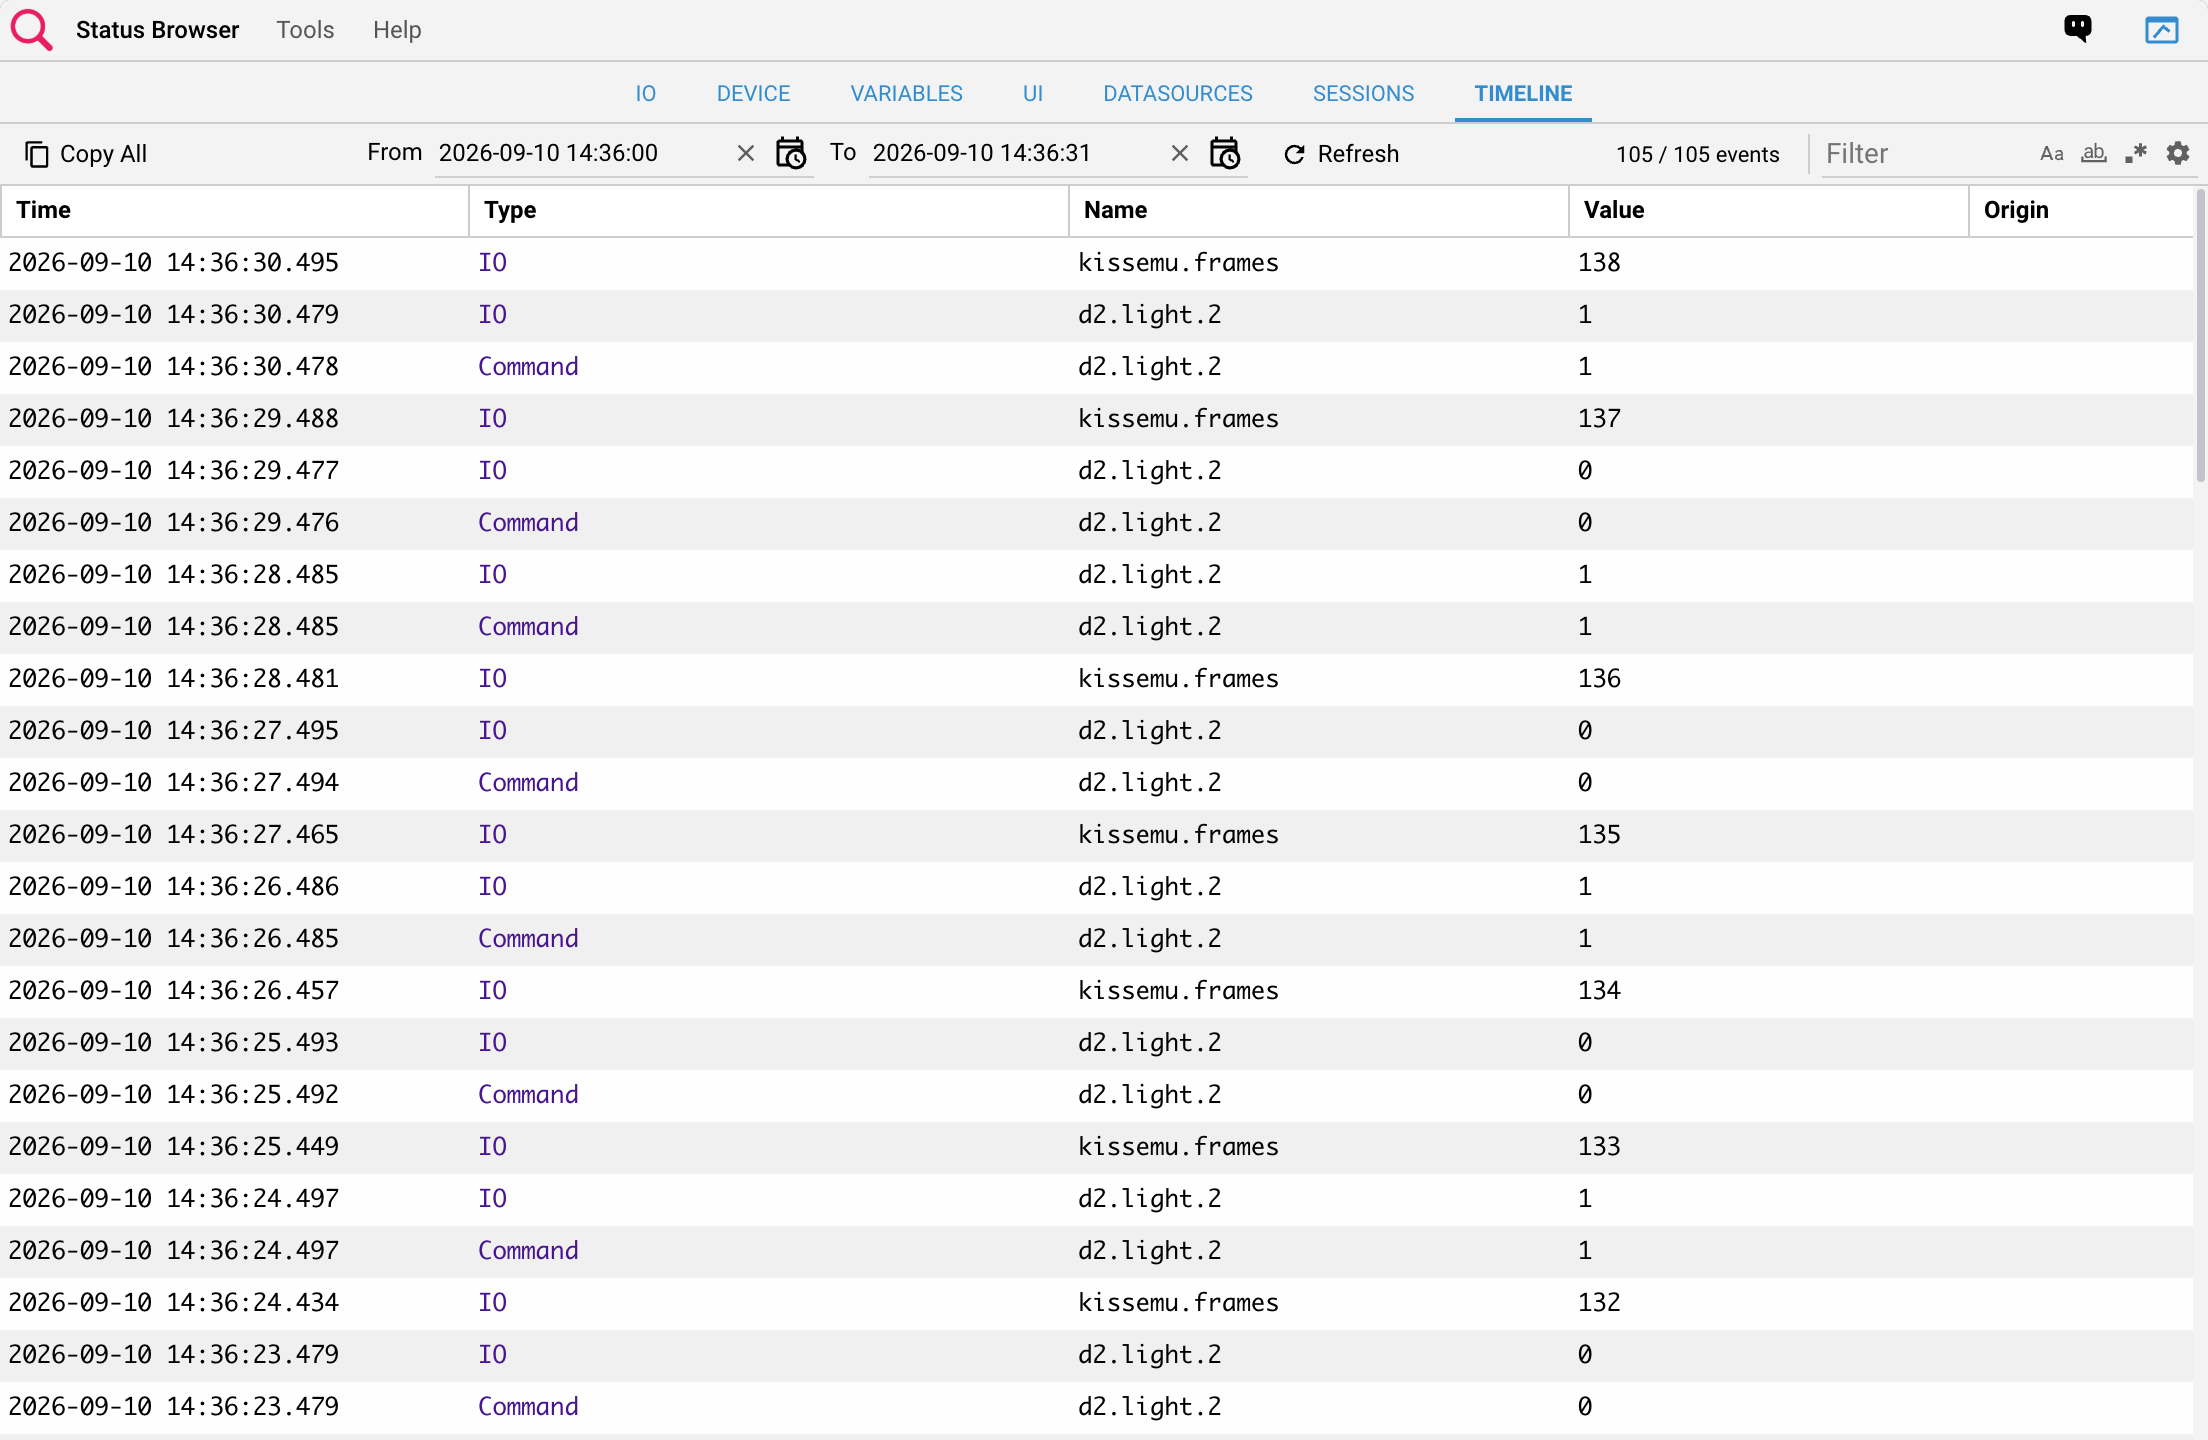
Use From and To to set the date range. Each can be typed as YYYY-MM-DD or YYYY-MM-DD HH:mm:ss, or picked with the calendar button. A date without a time means the start of the day for From and the end of the day for To. When both fields are empty, the last 24 hours are shown.
Records are loaded 1,000 at a time; press Load more to load more, up to 10,000 records. Beyond that, narrow the date range.
The tab is not updated in real time: press Refresh to reload the list. The Filter field and the search tool options filter the loaded events, and the counter next to Refresh shows the filtered events out of the loaded events (e.g. 550 / 550 events). Copy All copies the listed events to the clipboard.
Timeline of a data point or variable
In the IO and Variables tabs, when you hover a value, the timeline icon is shown if the item has recorded events in the Timeline. Only the items matched by a Timeline rule have recorded events.

Press the icon to open the Timeline popup, which lists the recorded values of that item, newest first, with their time and origin.
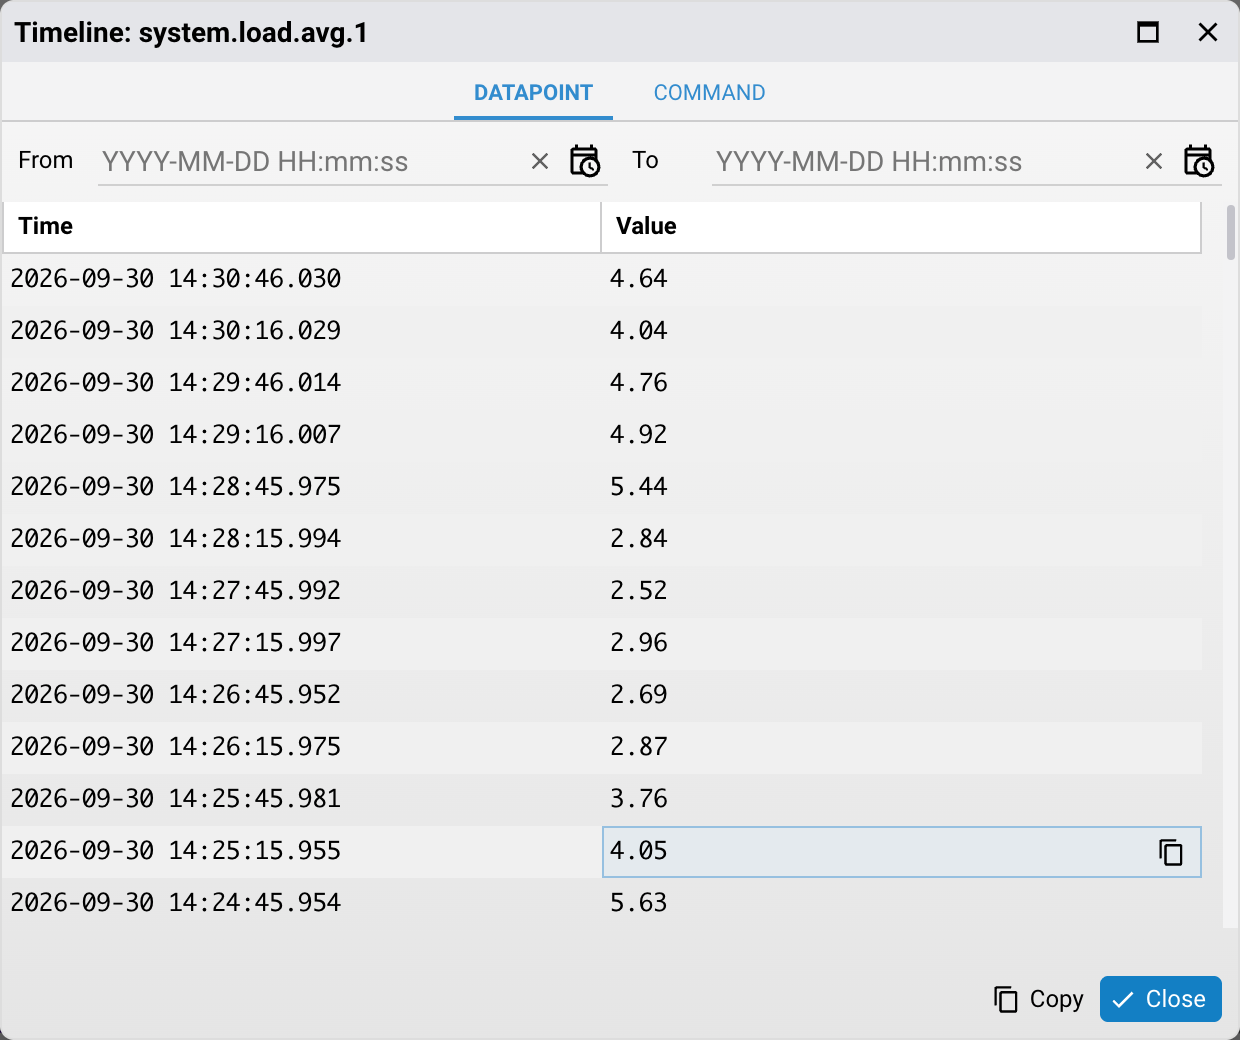
For I/O data points, the DATAPOINT and COMMAND tabs switch between the status changes of the data point and the commands sent to it.
The From and To fields, and the load and 10,000-record limits, work as in the Timeline tab.
Each time and value can be copied with the copy icon shown when you hover it. The Copy button in the popup footer copies the whole list as tab-separated text, ready to paste in a spreadsheet.
The popup can be resized and maximized.
The Origin column shows where a change came from. It is shown only when at least one of the listed records has an origin.
| Origin | Meaning |
|---|---|
HTTP | User interface objects, or the Manager |
EVENTS | An EVENTS action |
plugins.<class>.<method> | Java plugin code |
! | A data point update that did not trigger events |
| (empty) | Origin not known, e.g. a command sent by Java code outside a plugin, or an I/O status change |
Search Tool
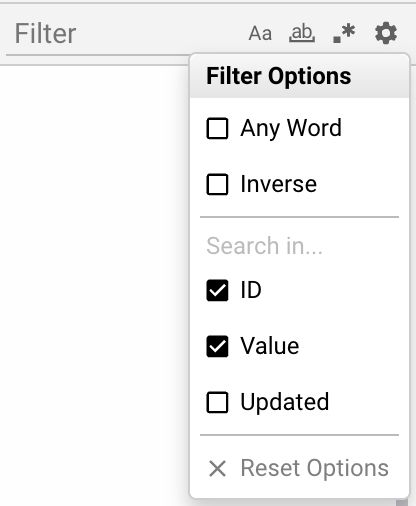
Select Aa for case sensitive filtering.
Select ab to match whole word.
Select .* for regular expressions.
Toggle Any Word to alternate between text searching for individual isolated words and text searching for the entire phrase.
Select Inverse to search for every log lines except the ones with the word in the filter field.
Edit Search In to search in IDs, values and updated values.
In any moment you can reset the filter options by pressing Reset options
Layout
Use Tools → Layout for workspace layout options.
Drag the boundaries between column headers to resize columns. Widths are remembered; Tools → Layout → Reset column widths restores the active tab's defaults.